Introductory Tours
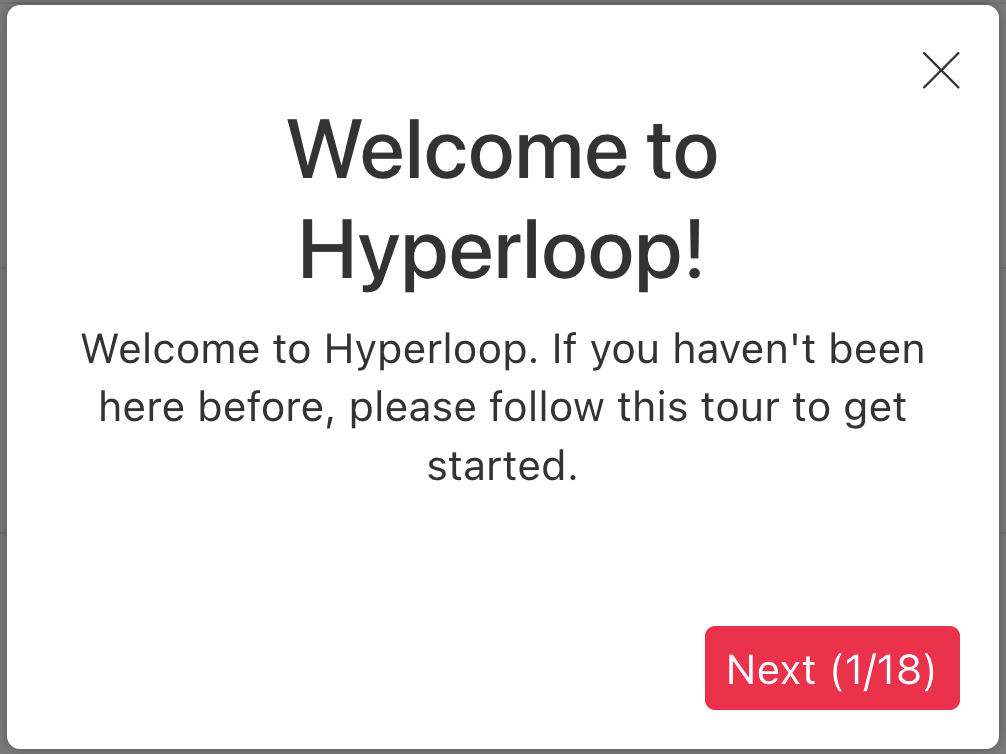
When opening a page in Hyperloop which has not been visited before, a guided tour will explain key concepts. These tours provide an interactive learning experience for Hyperloop, easily activated with a single click. They are ideal for beginners and for refreshing knowledge.
Where appropriate, when one tour ends, the next will begin to explain the next section of Hyperloop. Tours can be exited at any time. Once closed, they will not automatically begin on future page visits.
Tour Elements
- Each element of Hyperloop with a tour includes a tour 🚌 button. Clicking this button initiates the tour.

- Each tour step includes a Next button to access the next step of the tour. The page will automatically scroll to and highlight the next element to be explained. Also displayed is the current step number and total number of steps in the tour.

-
Each tour step additionally includes an exit button. Clicking this closes the tour. After clicking this, the tour of the given section will not automatically open on future visits to the section of Hyperloop. To access the tour of the section again, the relevant tour 🚌 button must be clicked.
-
Many tours also offer direct links to relevant sections of the documentation for in-depth explanations, reducing the need to search through the documentation.
My Analyses
- My Analyses is a personalized webpage which displays all the analyses where the user belongs to.
- Analyses can be expanded/collapsed with the buttons
✚-and they can be reordered with the buttons⇧⇩or by dragging and dropping. This configuration is saved per user. - The user can create/delete, configure and enable/disable wagons in this page.
- The user can add/remove datasets per analysis.
- Receiving emails on wagon test failure can be configured per analysis in
Datasets and Settings 📝. It can be set to: none, all analyzers or only user who enabled the wagon.
Service wagons
The Service wagons are wagons which are dependencies to other wagons. They are created by experts, and you can add it as a dependency to your wagon in edit wagon.
- For the users, in the My Analyses page, there is a read only view of the Service Analyses available on the top of the page.
- For the experts, if you need to create Service wagons, you need to have an analysis with the project type O2 Hyperloop Service Wagons (OHSW) which can be created in JIRA. Once the analysis is created, you can add a new wagon inside of the analysis available in My Analyses.
Adding and configuring a wagon
1. Adding a new wagon
Using the My Analyses page, inside of the Analysis you want to add the wagon to, click on ✚ Add new wagon.
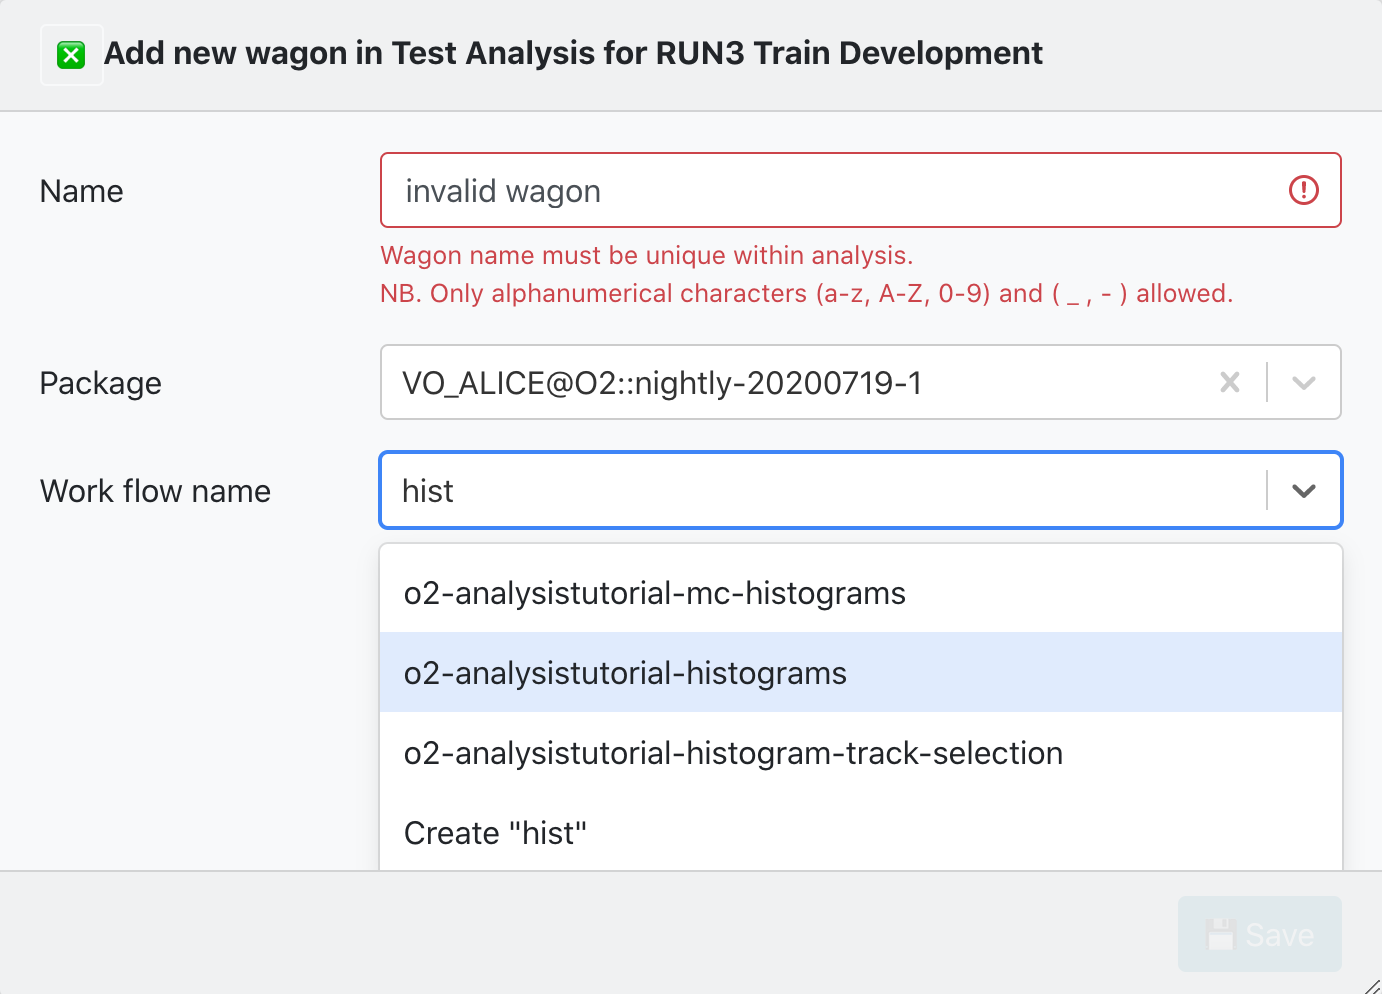
There are 2 parameters required to create a new wagon:
- Name: The newWagonName has to be unique within an Analysis, and it only accepts alphanumerical characters, no spaces.
- Work flow name: You can either select from a list of workflow_Names from an existing package tag. Or create a workflow_Name which belongs to a pull request.
By clicking on 💾 Save the wagon will be added, and you will be redirected to Edit Wagon where you can modify the wagon's configuration.
2. Cloning a wagon
- Using the My Analyses page, click on the button
🧬to clone a wagon.
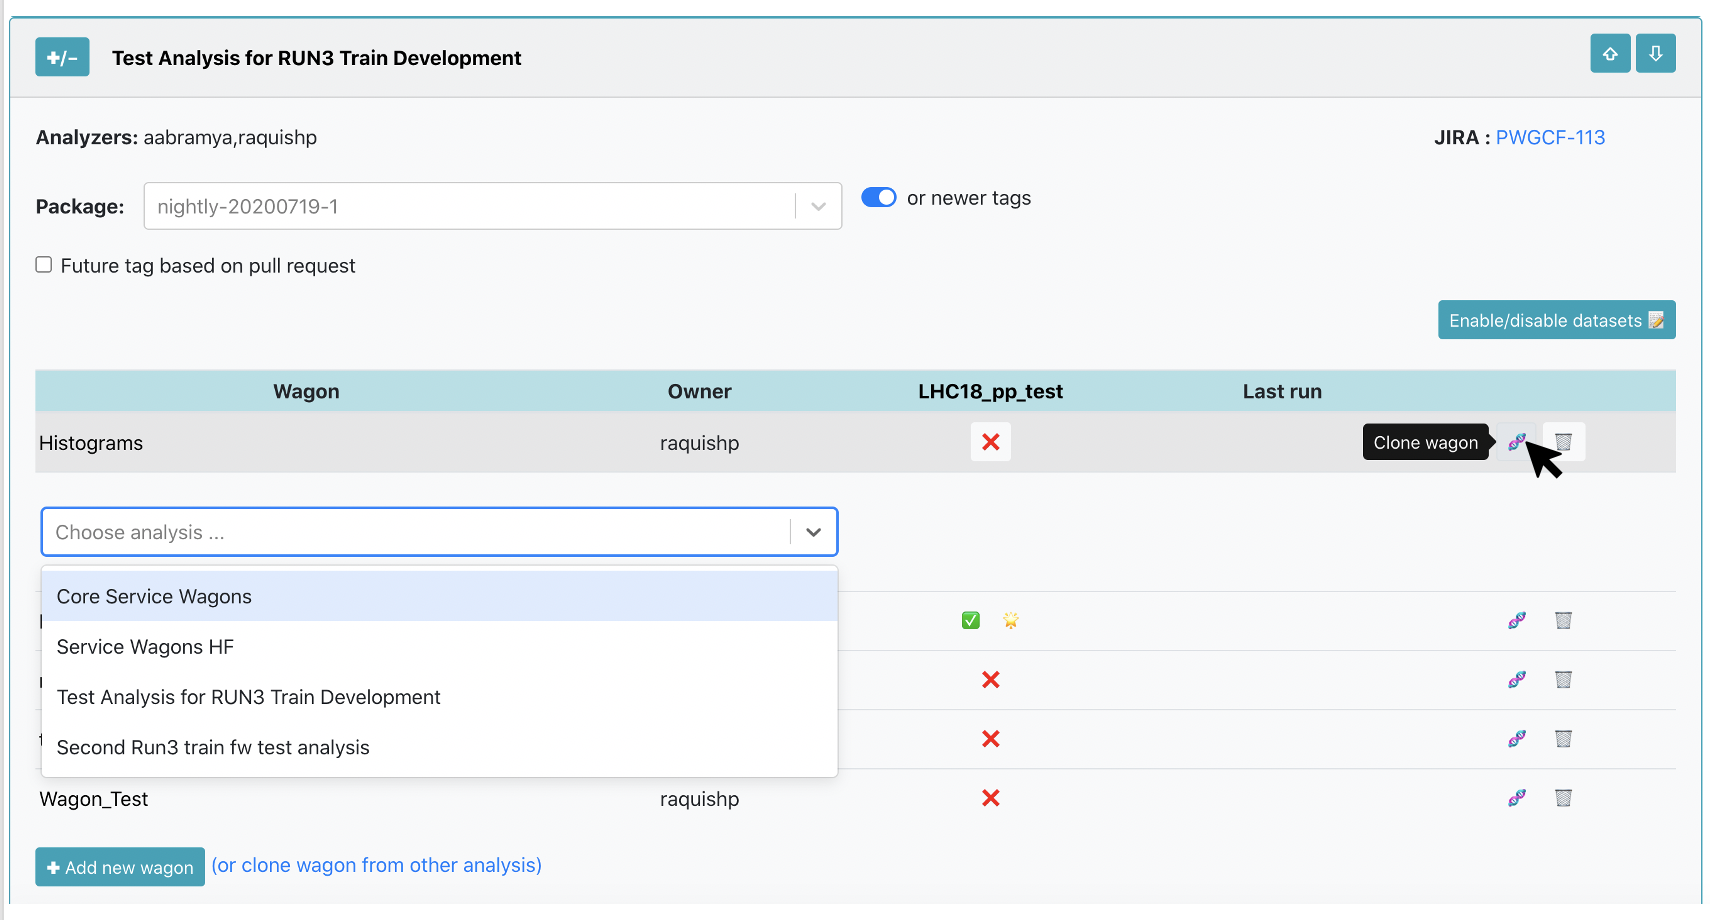
A list of Analyses you belong to will be displayed. You have to select the Analysis where you want to clone the Wagon to, and name the NewWagon (the wagon name has to be unique within Analysis). By clicking on 🧬 Clone, a new wagon will be added with the same configuration as the Wagon including subwagons and derived data.
- Using the All Analyses page:
You can get to the All Analyses page by using the main menu, or by the link in My Analyses page: (or clone wagon from other analysis). In the All Analyses page, a read only view of all the analyses available in the system will be displayed. Browse and click on the Analysis you want to clone the wagon from, and follow the procedure mentioned above.
3. Edit a wagon
- You can edit a wagon by clicking on the Wagon name in the My Analyses page. There are different tabs: Wagon settings, Configuration, Test Statistics.
- By clicking on the top-left corner, you will be redirected to a read-only view of the wagon, that can be shared with colleagues and support. The top right corner history symbol leads to the Wagon History page, which will display the state evolution of the wagon.
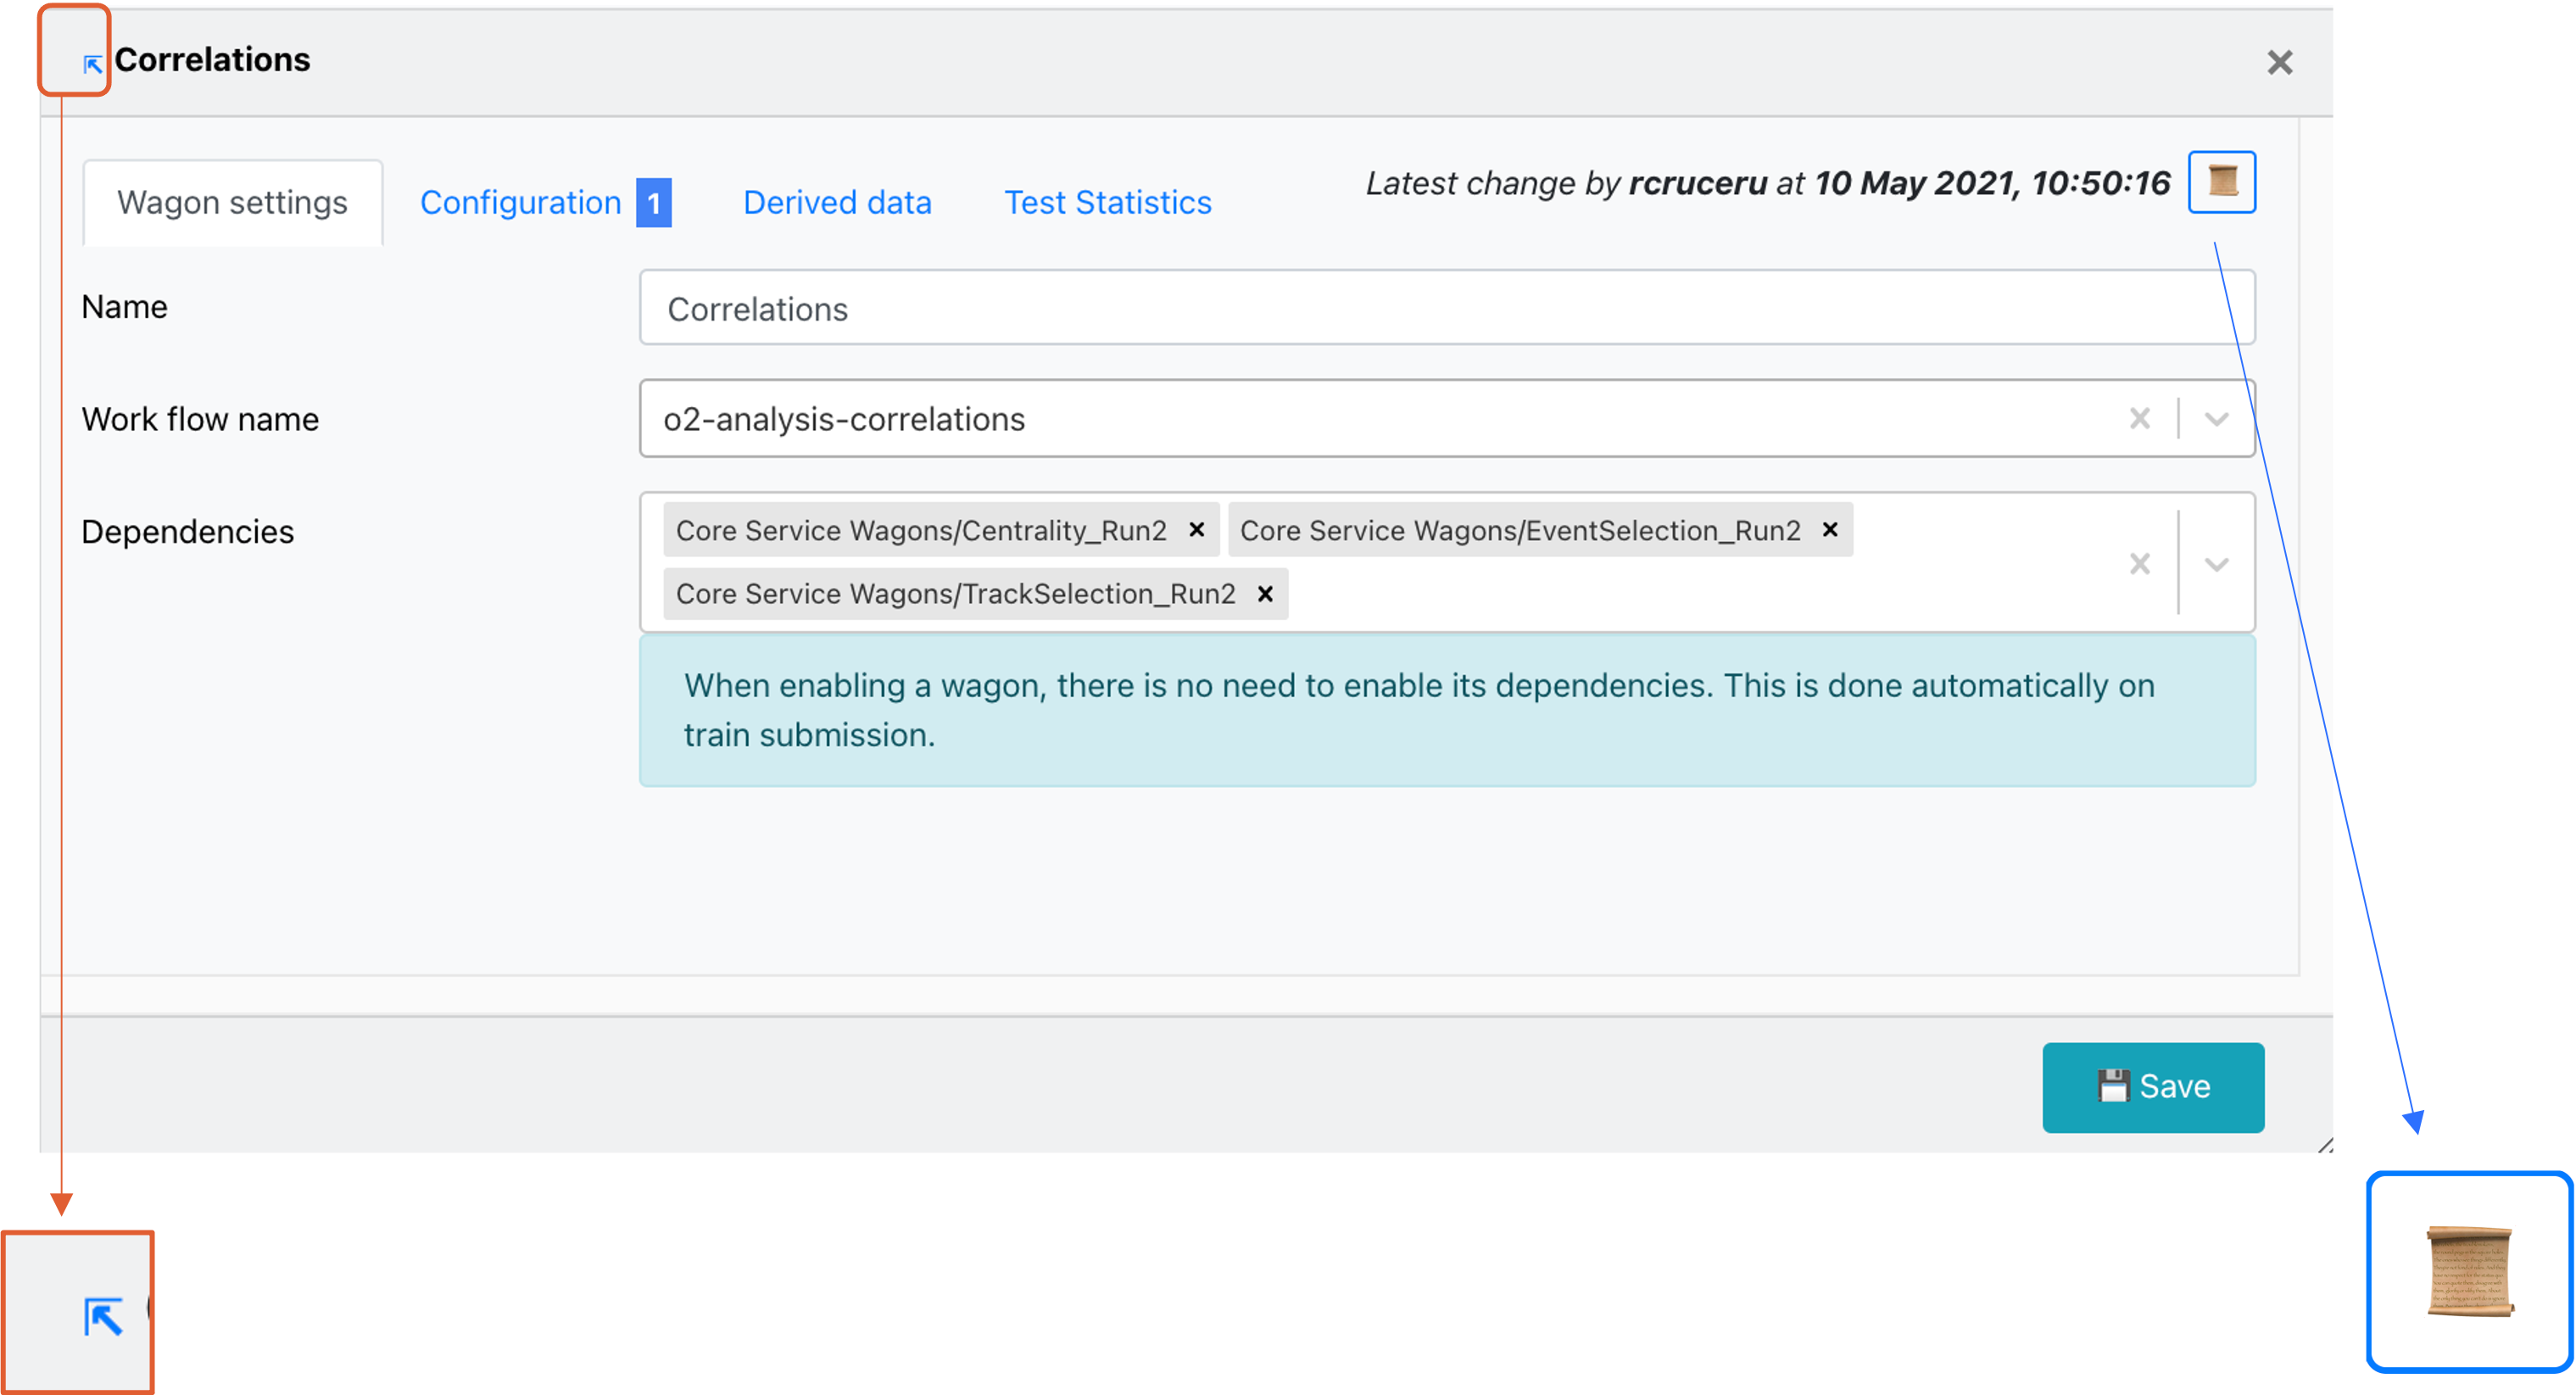
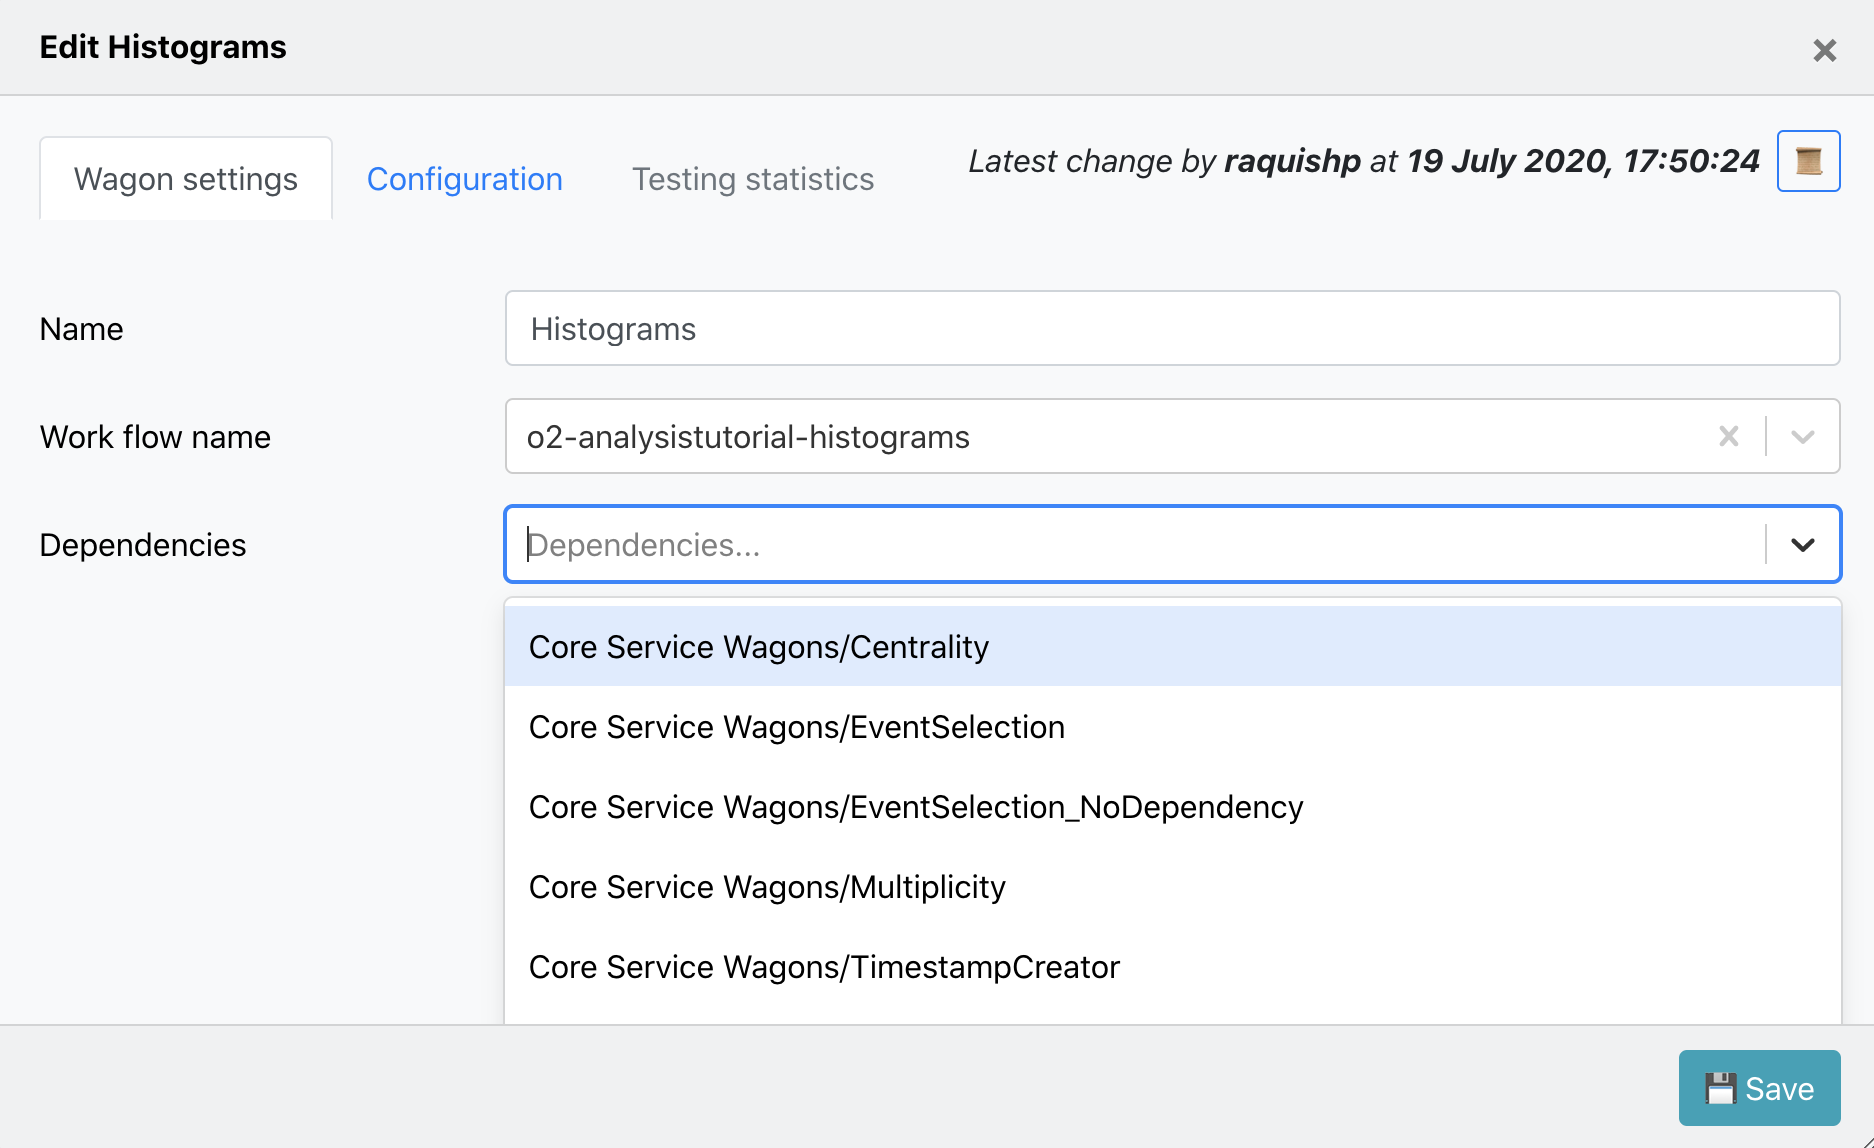
Wagon Settings
- In Wagon settings you can modify the wagon name, work flow name, and select wagon's dependencies. The dependencies offered are wagons from the same Analysis or from Service wagons.
Wagon Configuration
- In Configuration the wagon configuration corresponding to the workflow will be available in the Base. The configuration is divided per Task, hence if you need to add a new parameter, you will need add it in the following order: task, parameter and value.
- The wagon configuration supports a variety of parameter types defined in task as Configurable including: primitive type parameters, fixed-length arrays, variable-length arrays, matrices, labelled matrices and histogram binning.
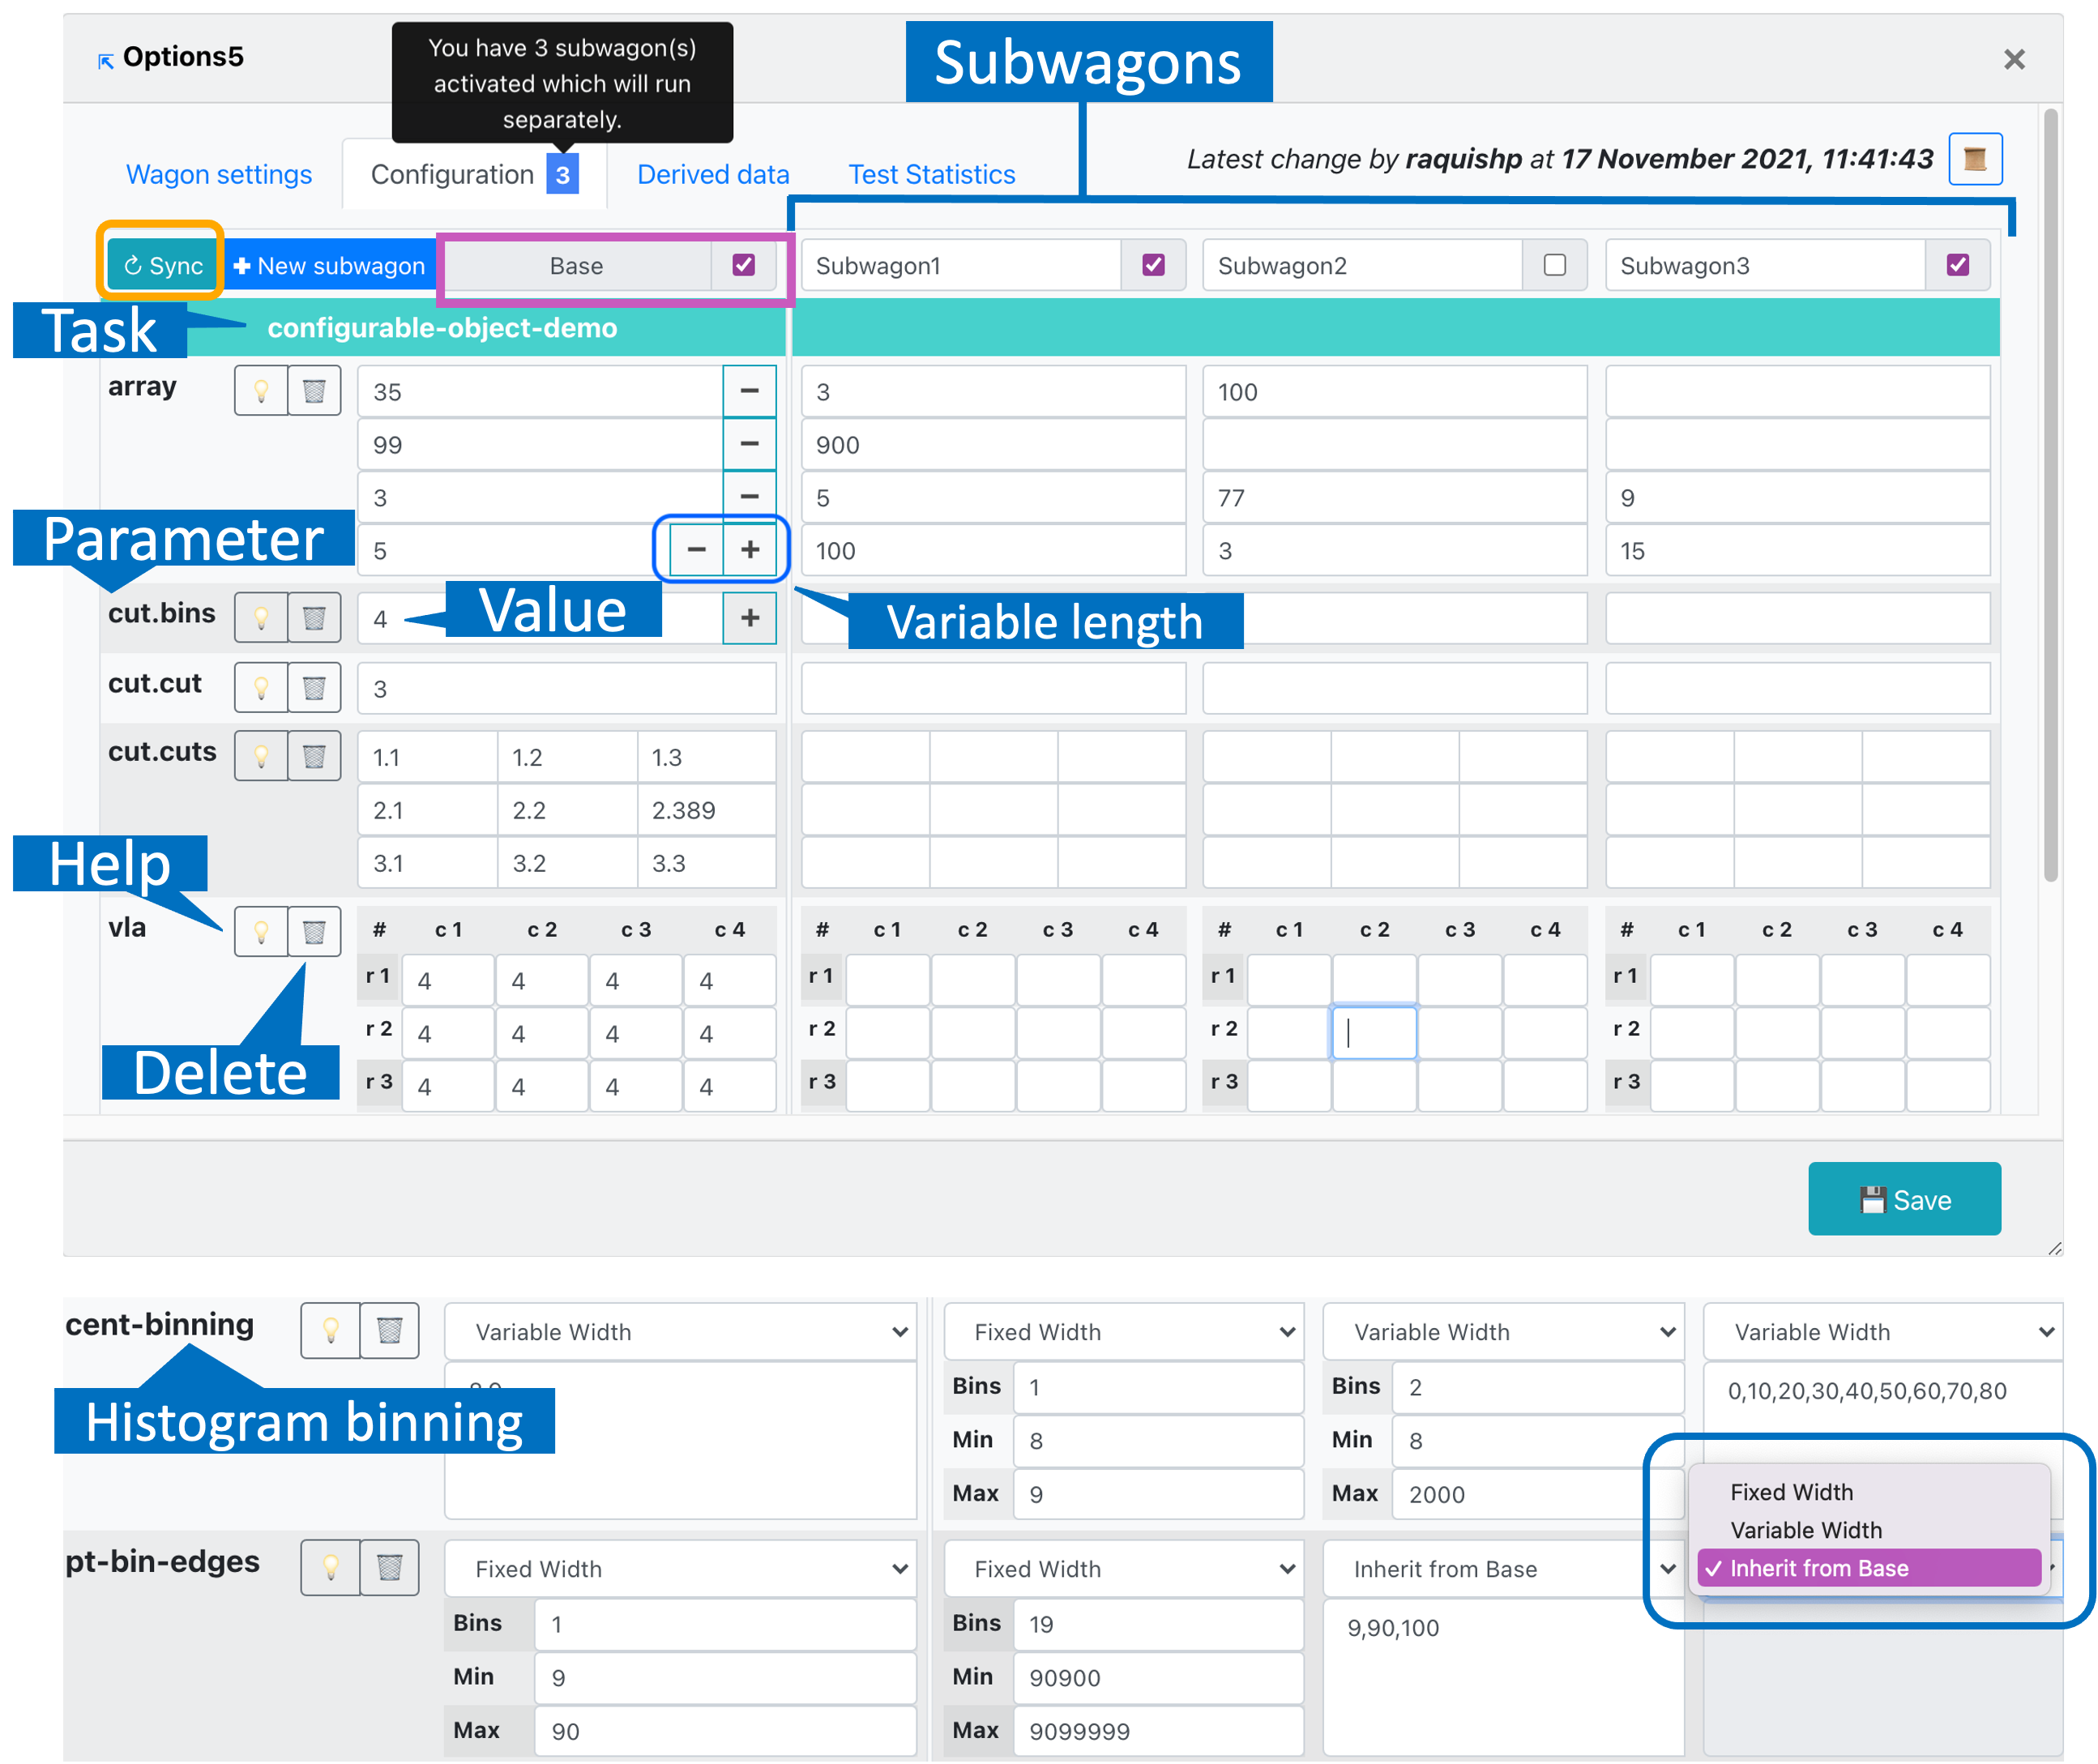
-
The Variable-length arrays allow the user to add/remove elements in the Base wagon, and the change will be propagated in all the subwagons.
- There are three options for histogram binning:
- Fixed width: Enter the number of bins, minimal and maximal value.
- Variable width: Enter a comma-separated list of bin edges.
- Inherit from base: This option is available for subwagons only and, if selected, the axis configuration will be the same as in the Base.
-
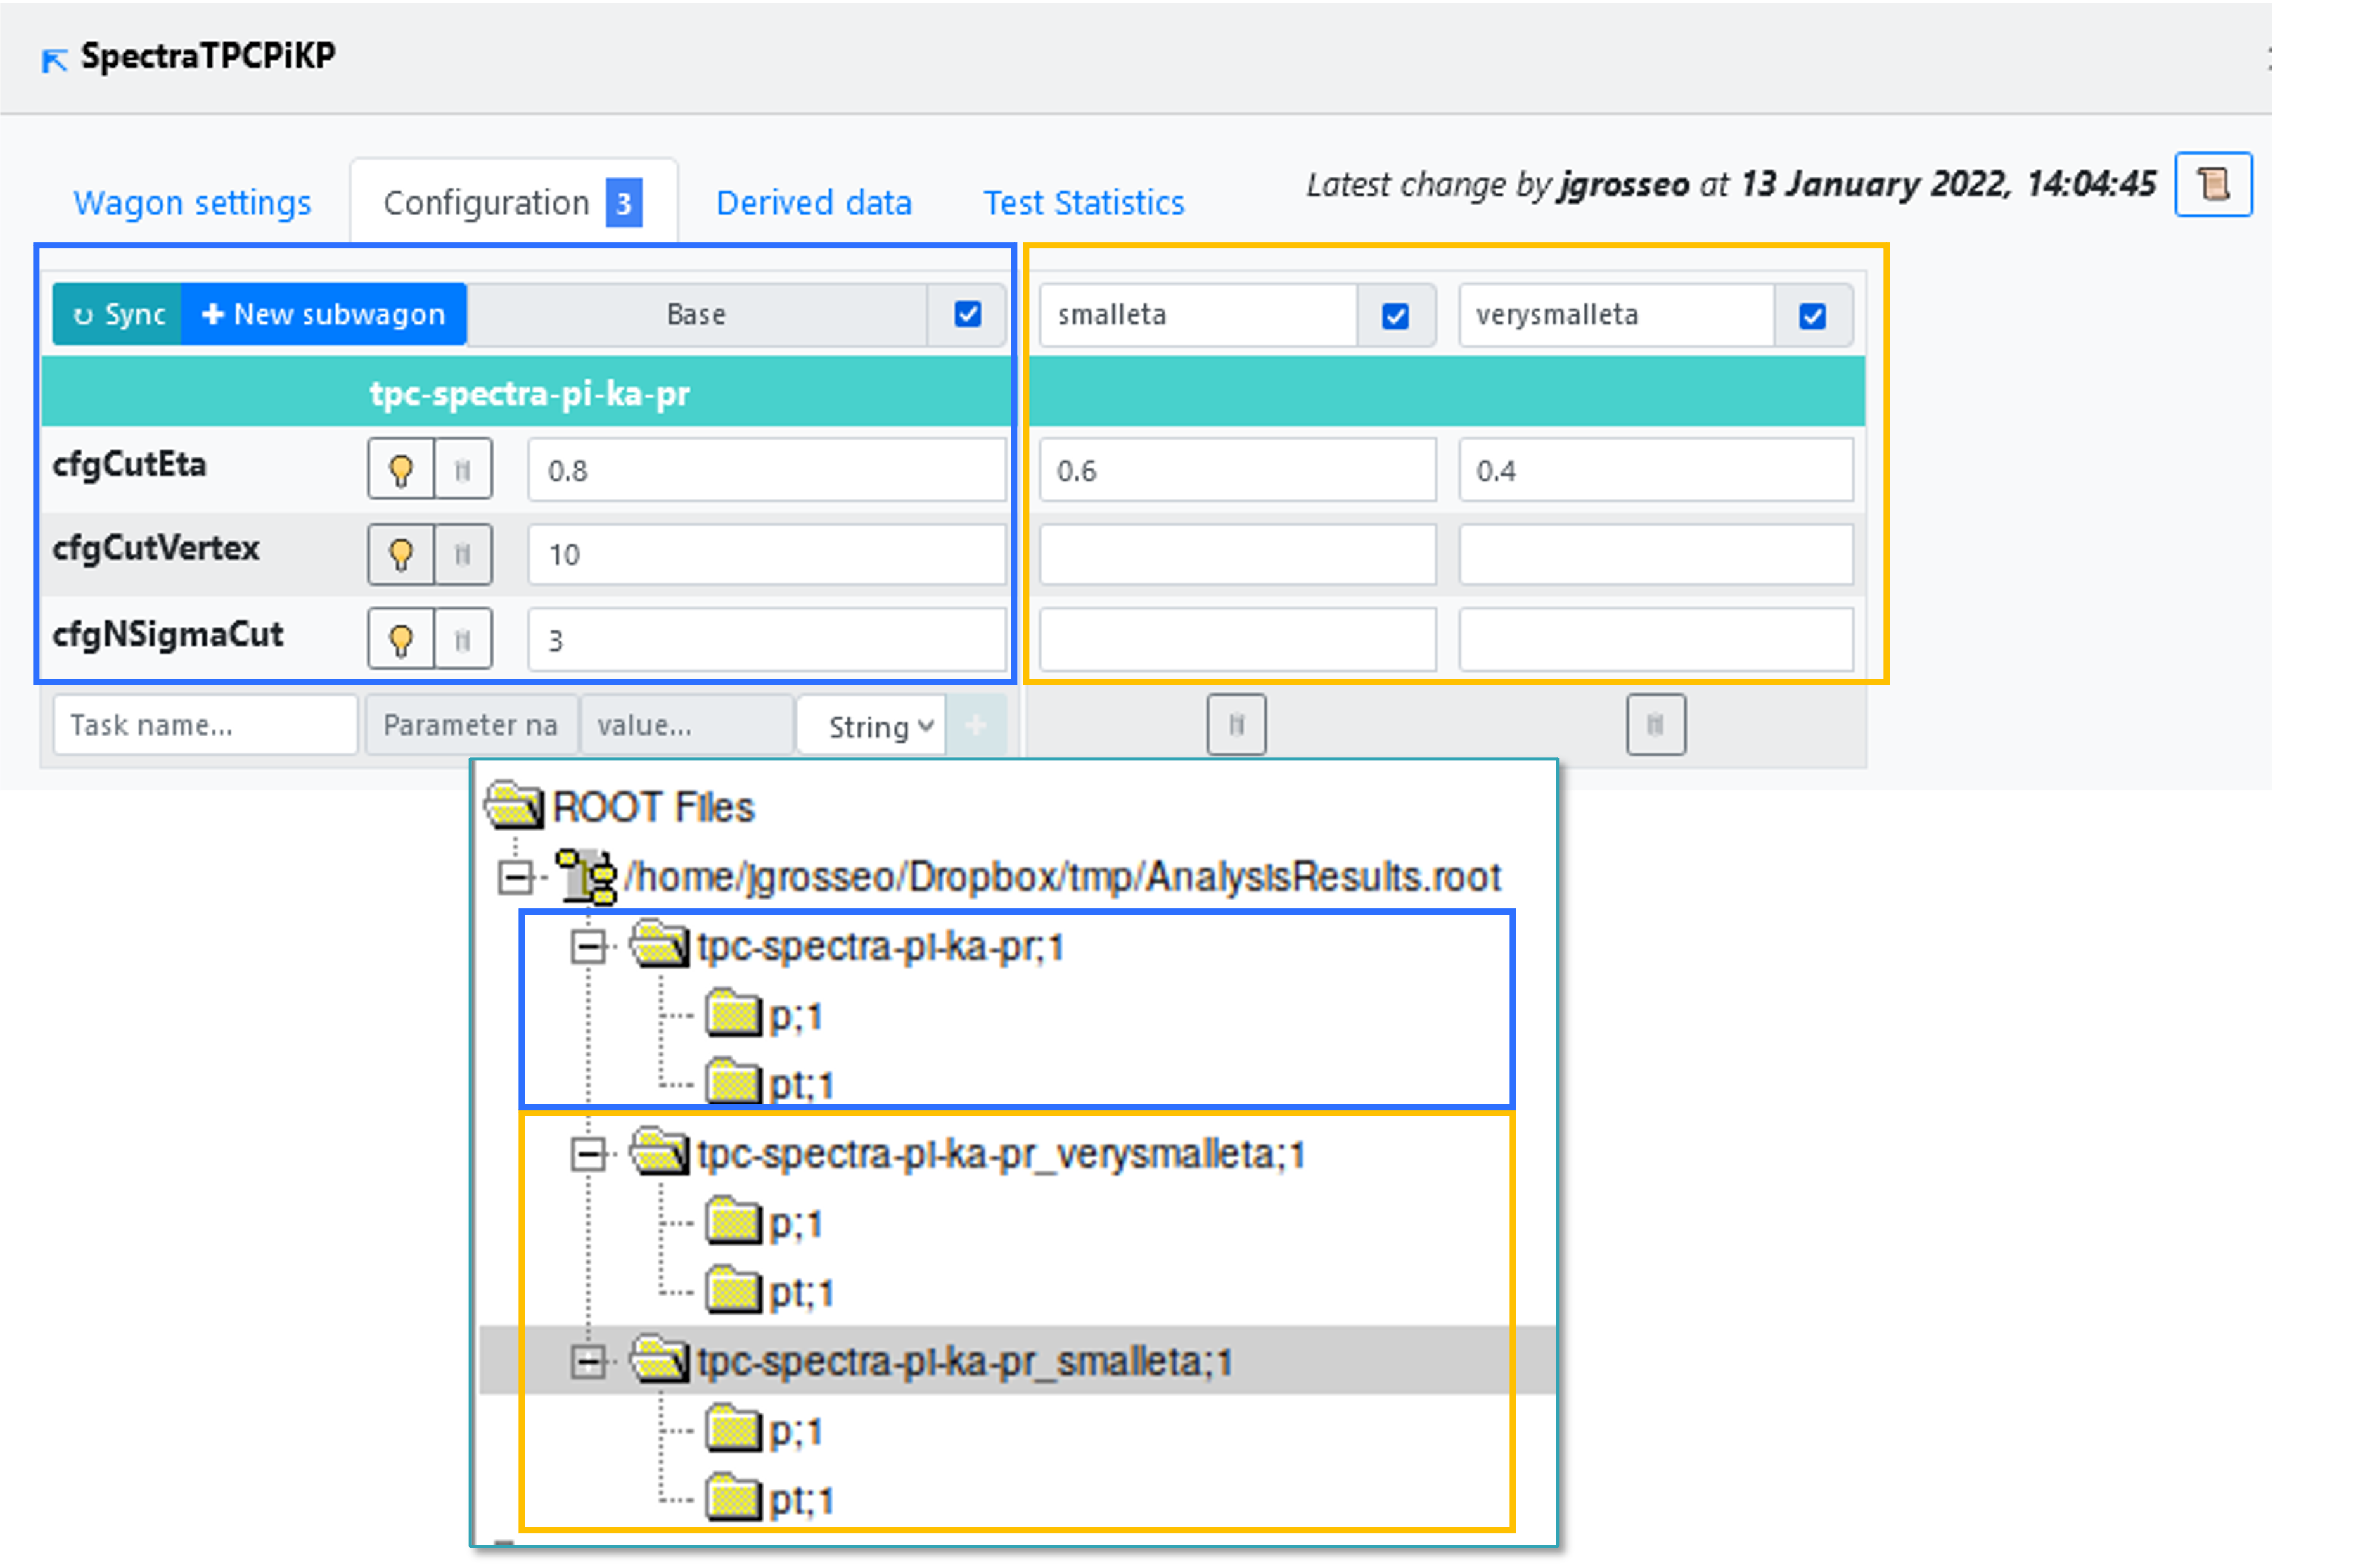
If you need to run the same workflow, but modify one (or more) of the parameter's value, you can use a subwagon instead of creating a new wagon. In order to create a subwagon, type the name of the new subwagon, the name has to be unique within the wagon, and type the value of at least one parameter in the configuration. The configuration of a subwagon will be kept the same as the Base and overwrite only the parameters that you provide.
- The subwagons added to the wagon will be represented with an automatically assigned suffix in AnalysisResults.root. Here you can see an example where we have added two subwagons called smalleta and verysmalleta.
- In order to update the base and subwagon configuration with the latest version of the workflow, click on the button
↻ syncin Configuration. By synchronizing the configuration, the parameters which no longer belong to the workflow will be removed, and the values of the wagon's Base will be updated as well if they have not been modified by the user.
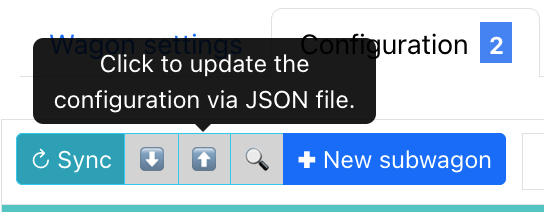
Upload Wagon Configuration via JSON
- The wagon configuration may be adjusted via JSON file. Any values in the wagon will be adjusted to the values in the JSON file.
- The required format for Hyperloop to ingest the JSON is the exact format given when downloading the configuration JSON file from Hyperloop (from the download button above). This download includes workflows from dependencies. When uploading, it is not necessary to remove dependencies - any workflows not directly from the wagon will be ignored during the upload.
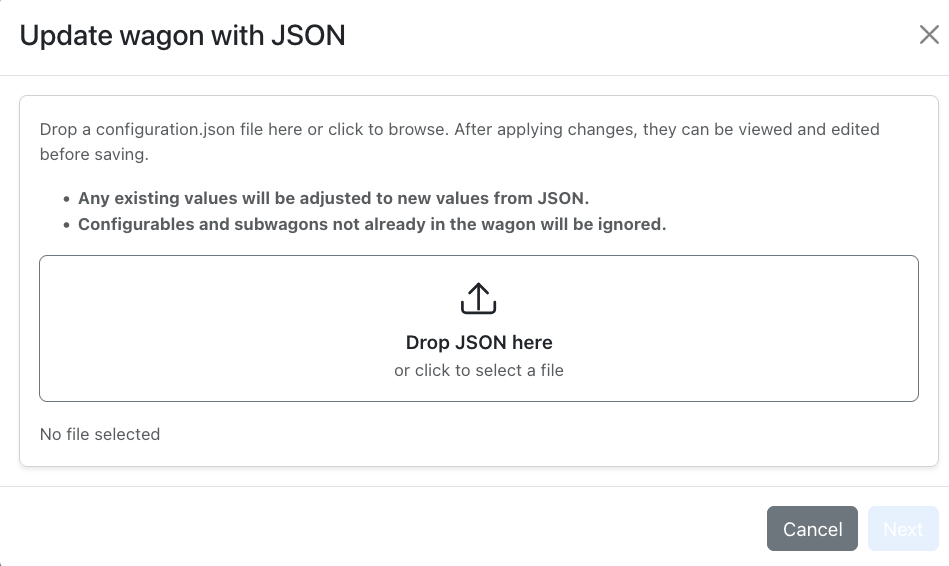
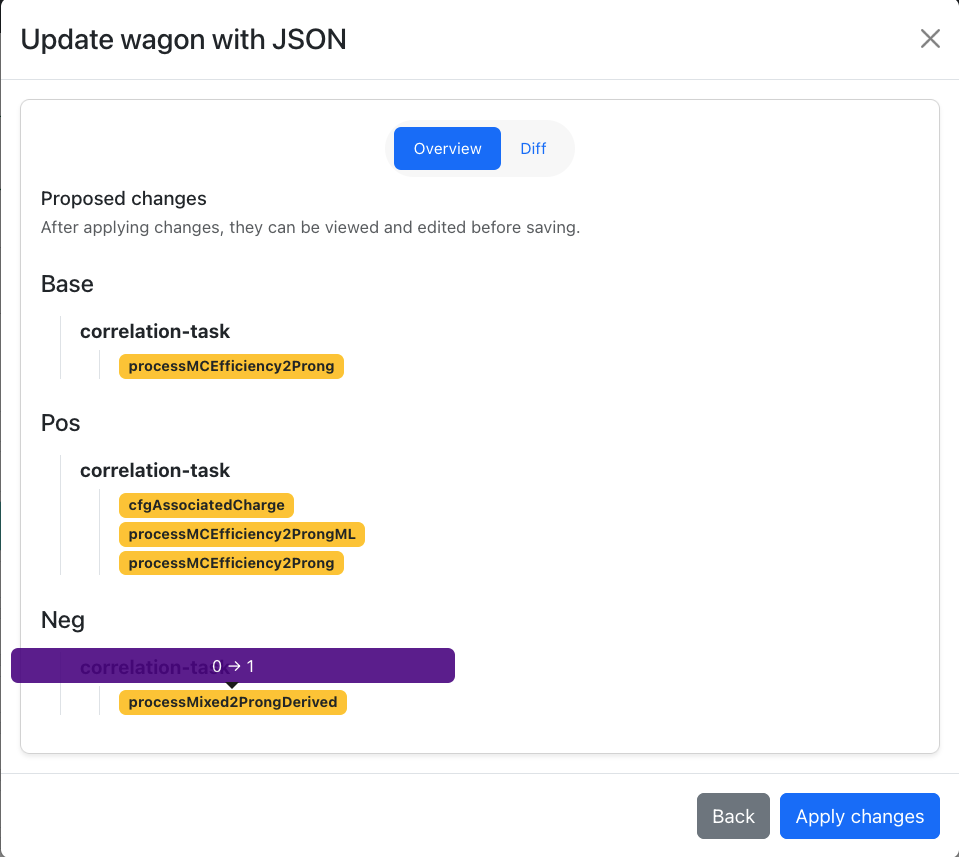
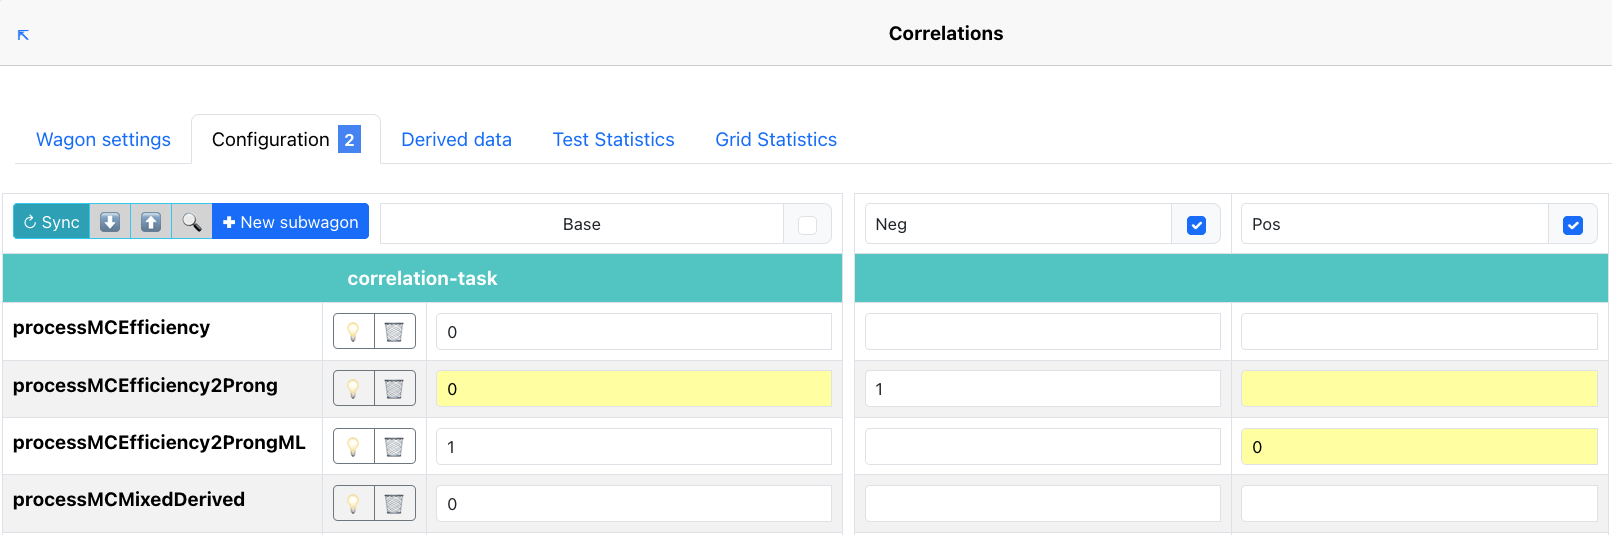
- Only configurables and subwagons which already exist in the wagon may be edited - any new subwagons or configurables in the JSON will be ignored. To add new subwagons, first add them to the existing wagon. When a file is chosen, each changed value is shown in the ‘overview'. All values in ‘base' are listed first, with subwagons listed below. In the example below, there are two subwagons, ‘Pos' and ‘Neg'. Hovering over any value will display the change in a tooltip.
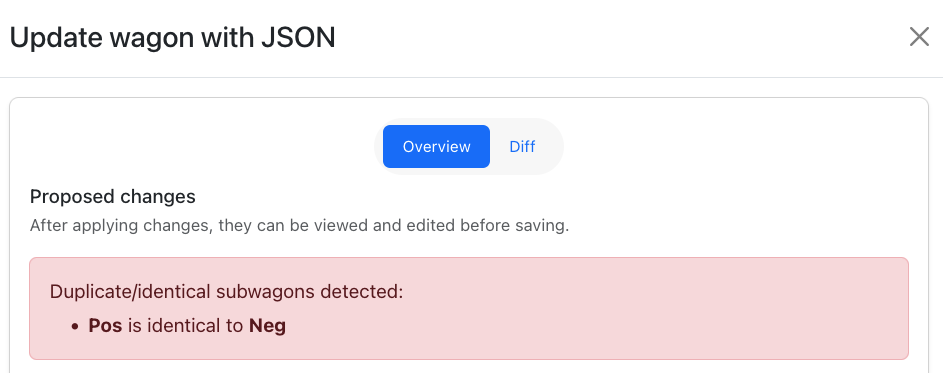
- There is validation to check for invalid values. It also ensures that there are no identical subwagons.
- A full diff between the current and uploaded configuration is also available. Every difference between the current and uploaded configuration is shown.
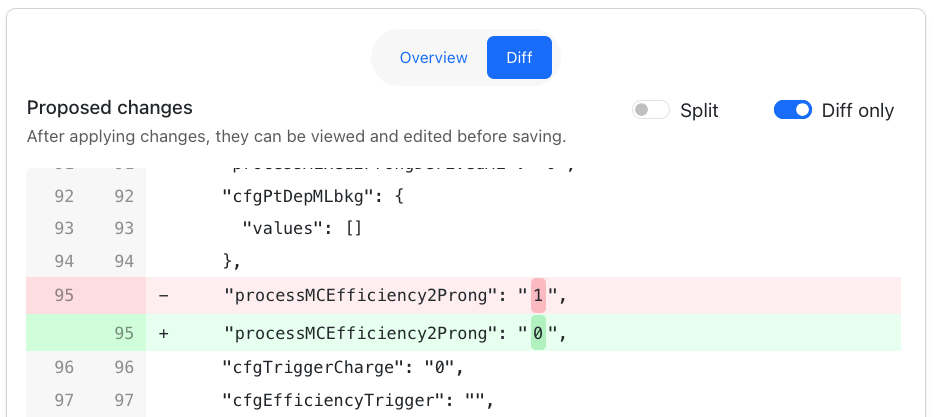
- Once ‘Apply Changes' is pressed, any altered values will be highlighted in yellow. No changes are saved until the ‘save' button is pressed, so it is possible to apply the changes to view them without losing the current configuration.
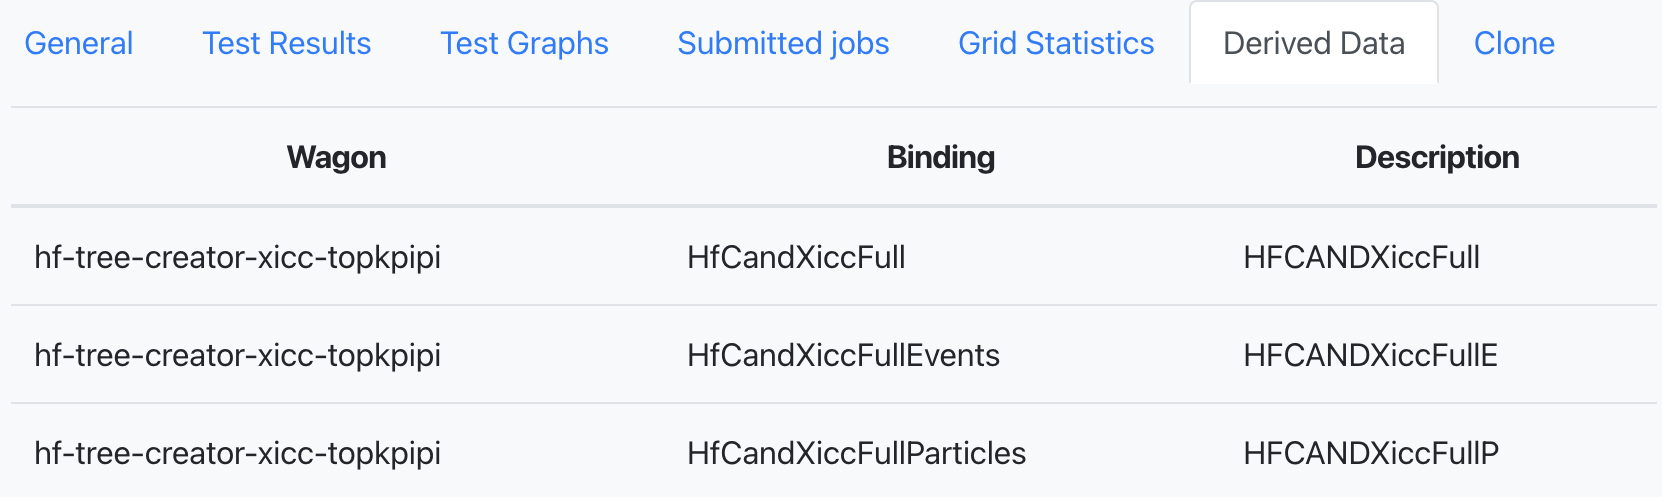
Derived data
- In Derived Data the tables which are produced by the task are displayed. If activated, these are saved to the output if the train is run as a derived data production. The produced derived data can be made available by the operators and serve as input for subsequent trains.
Derived data types
- There are three types of derived data specifications:
- Standard derived data (marked with 🗂️)- if the wagon is used in a train, this will produce derived data to be used for further analysis. The results will not be merged across runs and can be used as input for future train runs. Note that standard derived data trains do not submit automatically and may need additional approval. If in doubt, please seek advise before enabling derived data tables in your wagon configuration.
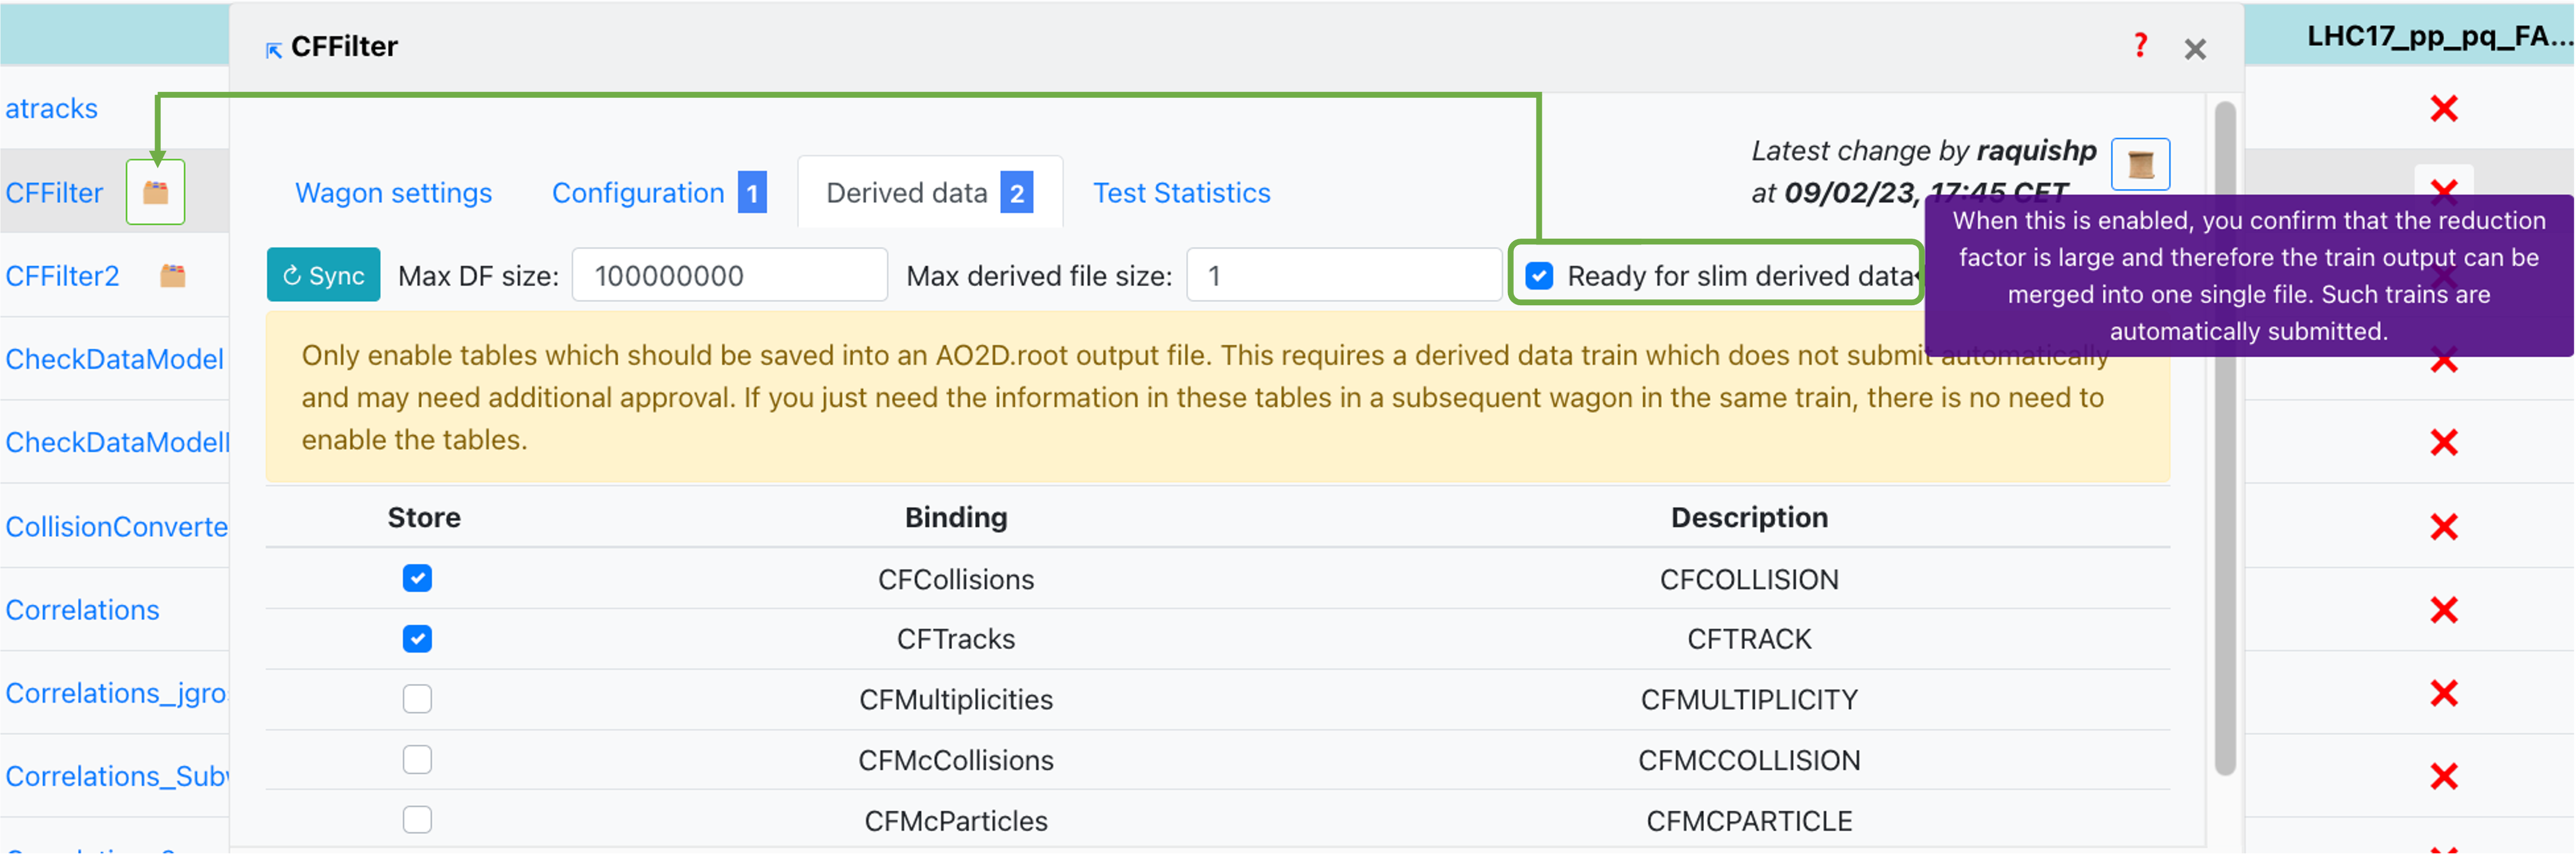
- Slim derived data (marked with green bordered 🗂️) - similarly to the standard derived data case, if used in a train, this will produce derived data to be used for further analysis. This is reserved for derived data of small output size. The results will be merged across runs and are not available to use in future train runs. The data will be automatically deleted after a preset period of time. You can mark a wagon for running as slim derived data by checking
Ready for slim derived data. - Linked derived data (marked with red bordered 🗂️) - linked derived data trains will also produce derived data to be used for further analysis. Linked derived data has access to the parent AO2D - this is not the case for other derived data types. Like standard derived data, results are not merged across runs.
- For wagons set as ready for slim derived data, two more fields need to be correctly set:
- Max DF size - This sets the maximal dataframe size in the merging step. Has to be 0 for not-self contained derived data (which need parent file access).
- Max derived file size - Sets the size limit for the output file size of the derived data file. This is an expert parameter which usually does not have to be changed. Only change this value if the processing in subsequent trains takes so long that the jobs fail. If set to 0 a good value will be automatically determined.
When enabling Ready for slim derived data the option has to be selected for the main wagon and all dependencies which produce derived data.
- In order to update the derived data configuration with the latest version of the workflow, click on the button
↻ syncin Derived data. By synchronizing the derived data, the tables which no longer belong to the workflow will be removed, and the values of the tables will be updated.
Test Statistics
- Test Statistics contains three graphs that display different metrics following the tests this wagon was part of. The first graph plots the PSS Memory corresponding to each test run. The second one diplays the CPU Time, Wall time and Throughput along the test runs for this wagon. Finally, the third graph shows the Output size at each test run.
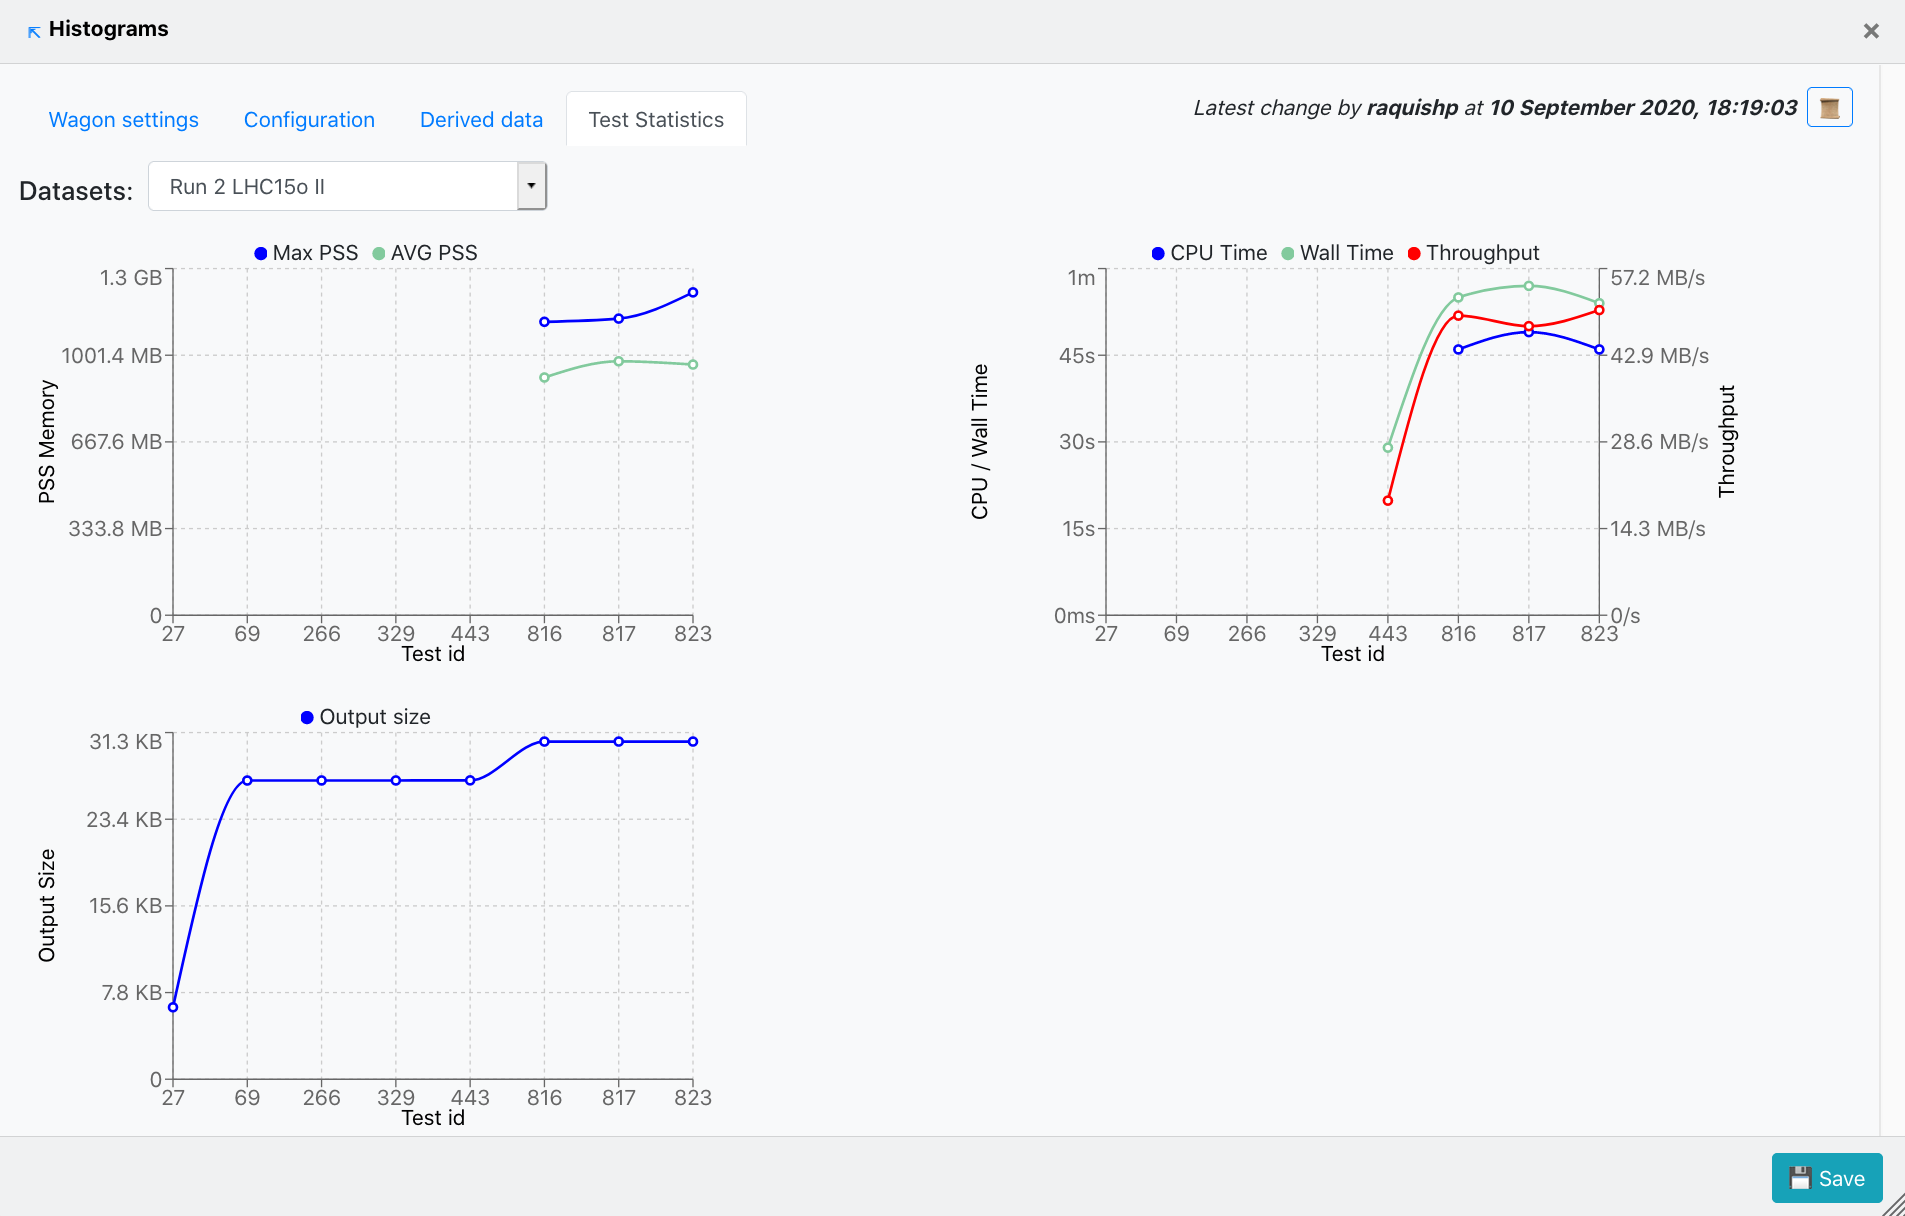
- Depending on the datasets this wagon is using, the user is able to choose the Dataset on which the metrics mentioned above are plotted, from the upper-left dropdown. In case no tests were run on the chosen dataset, a message will appear stating this.
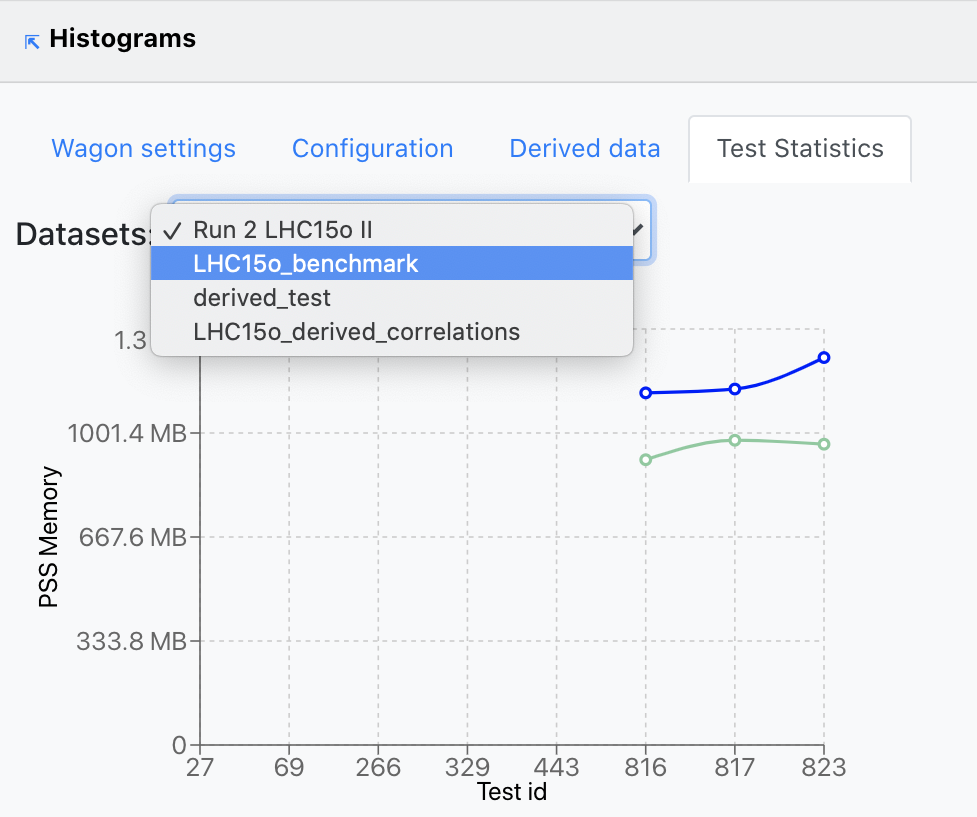
- By clicking on the bullets representing the metric value at any of the test runs plotted, the user will open a new tab displaying a read-only view of the wagon test output.
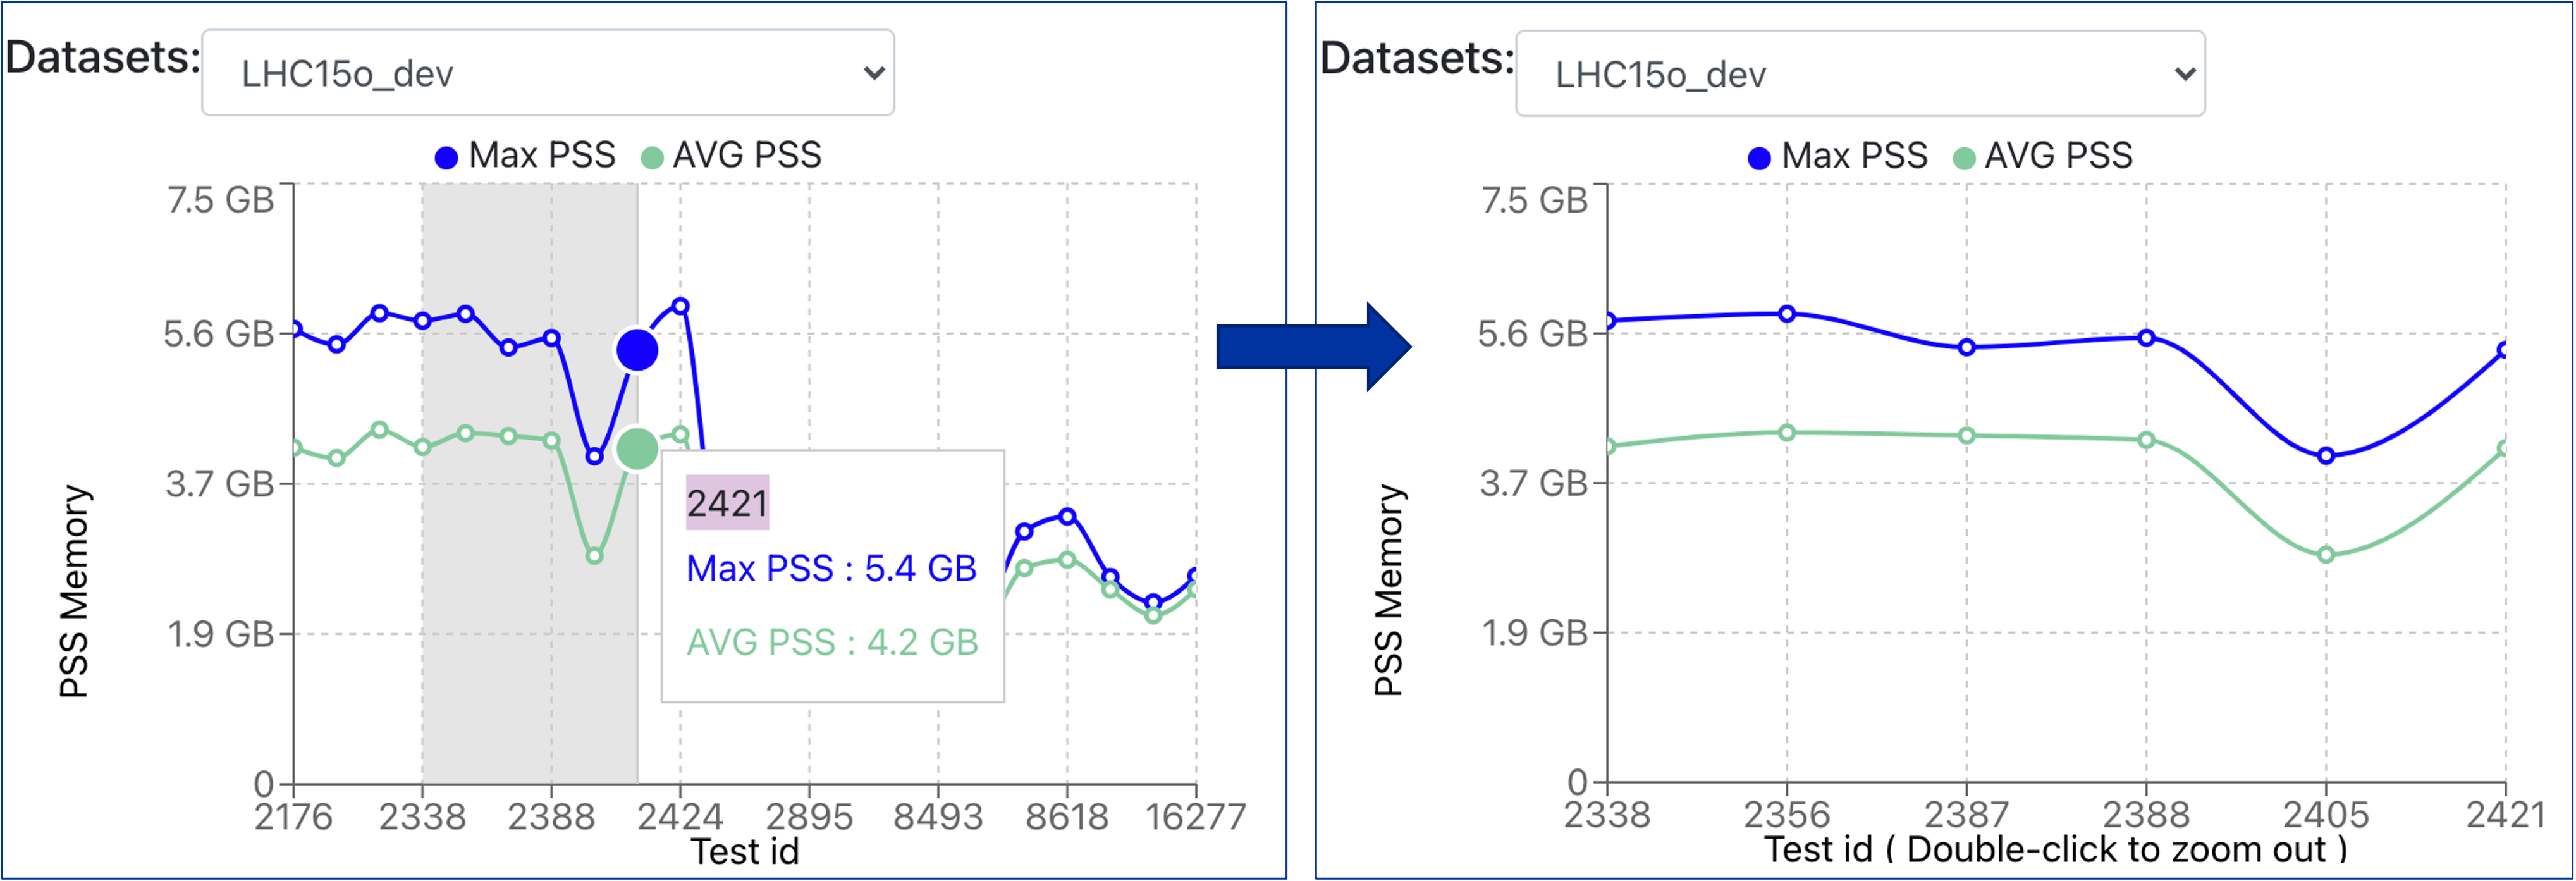
- In order to zoom into the graph, the user needs to click and drag over the are of interest, which will automatically show the zoomed-in graph portion. By double-clicking, it will zoom out and show the entire graph.
4. Wagon History
- In the Wagon History page, there is a summary of the wagon's state from the creation until the last update. By clicking on the + symbol, one can expand the information, showing the subwagons' details and the derived data at each timestamp.
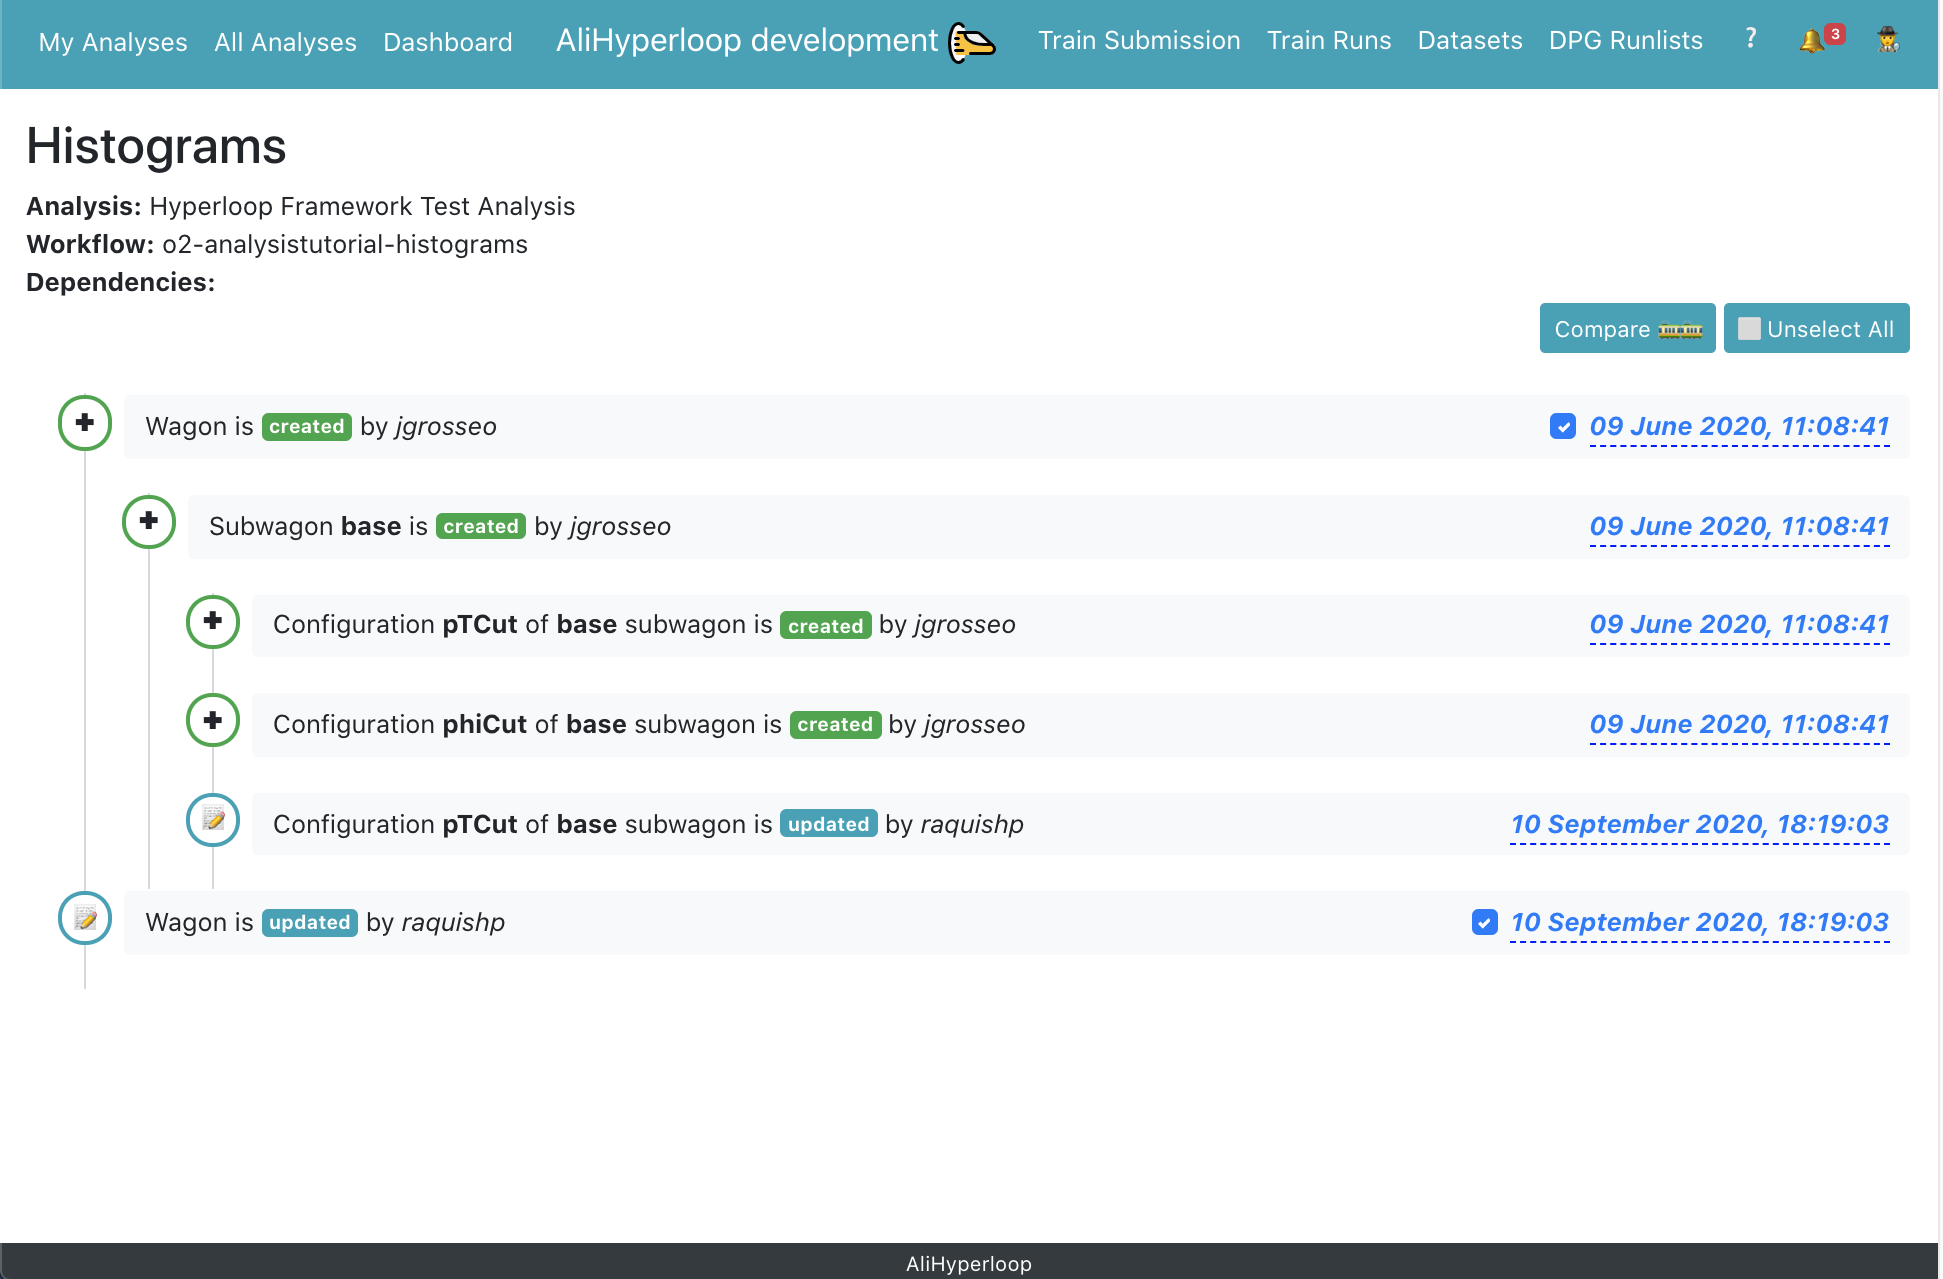
- On the right side of the page, the user can select two timestamps in order to compare the state of the wagon between the two by clicking Compare. This will lead to Compare Wagons page. You can cancel your current selection by clicking Unselect all.
5. Compare wagon at different timestamps
-
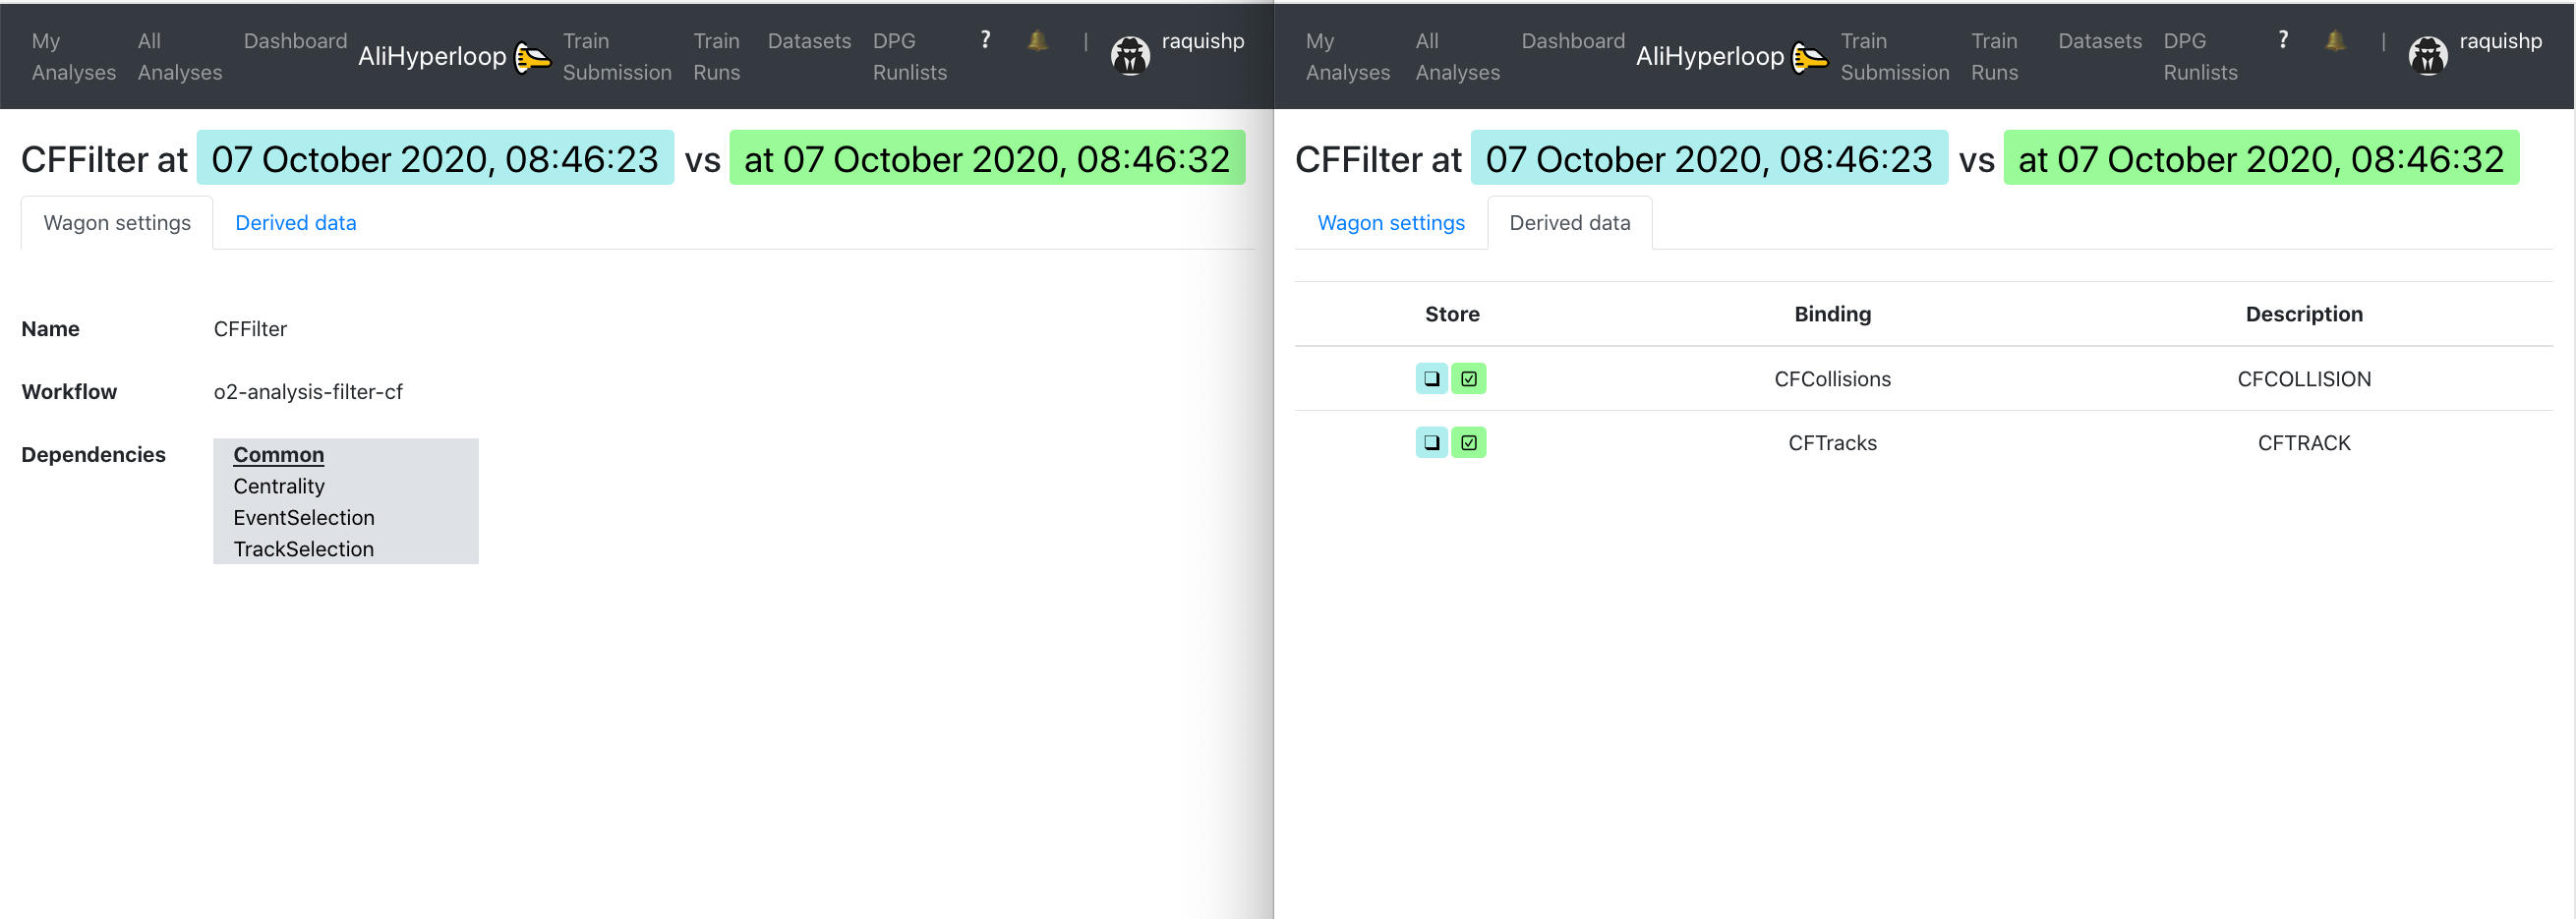
In the Compare Wagons view, we can analyse the state of a wagon at two different timestamps. The Wagon settings tab shows the changes regarding the name, workflow and dependencies and/or the common features between the two. By clicking on one of the dependencies, a new tab will open showing the comparison between the same two timestamps for the wagon clicked.
-
The Derived data tab reflects the differences concerning the derived data at the two timestamps.
6. Compare individual wagons
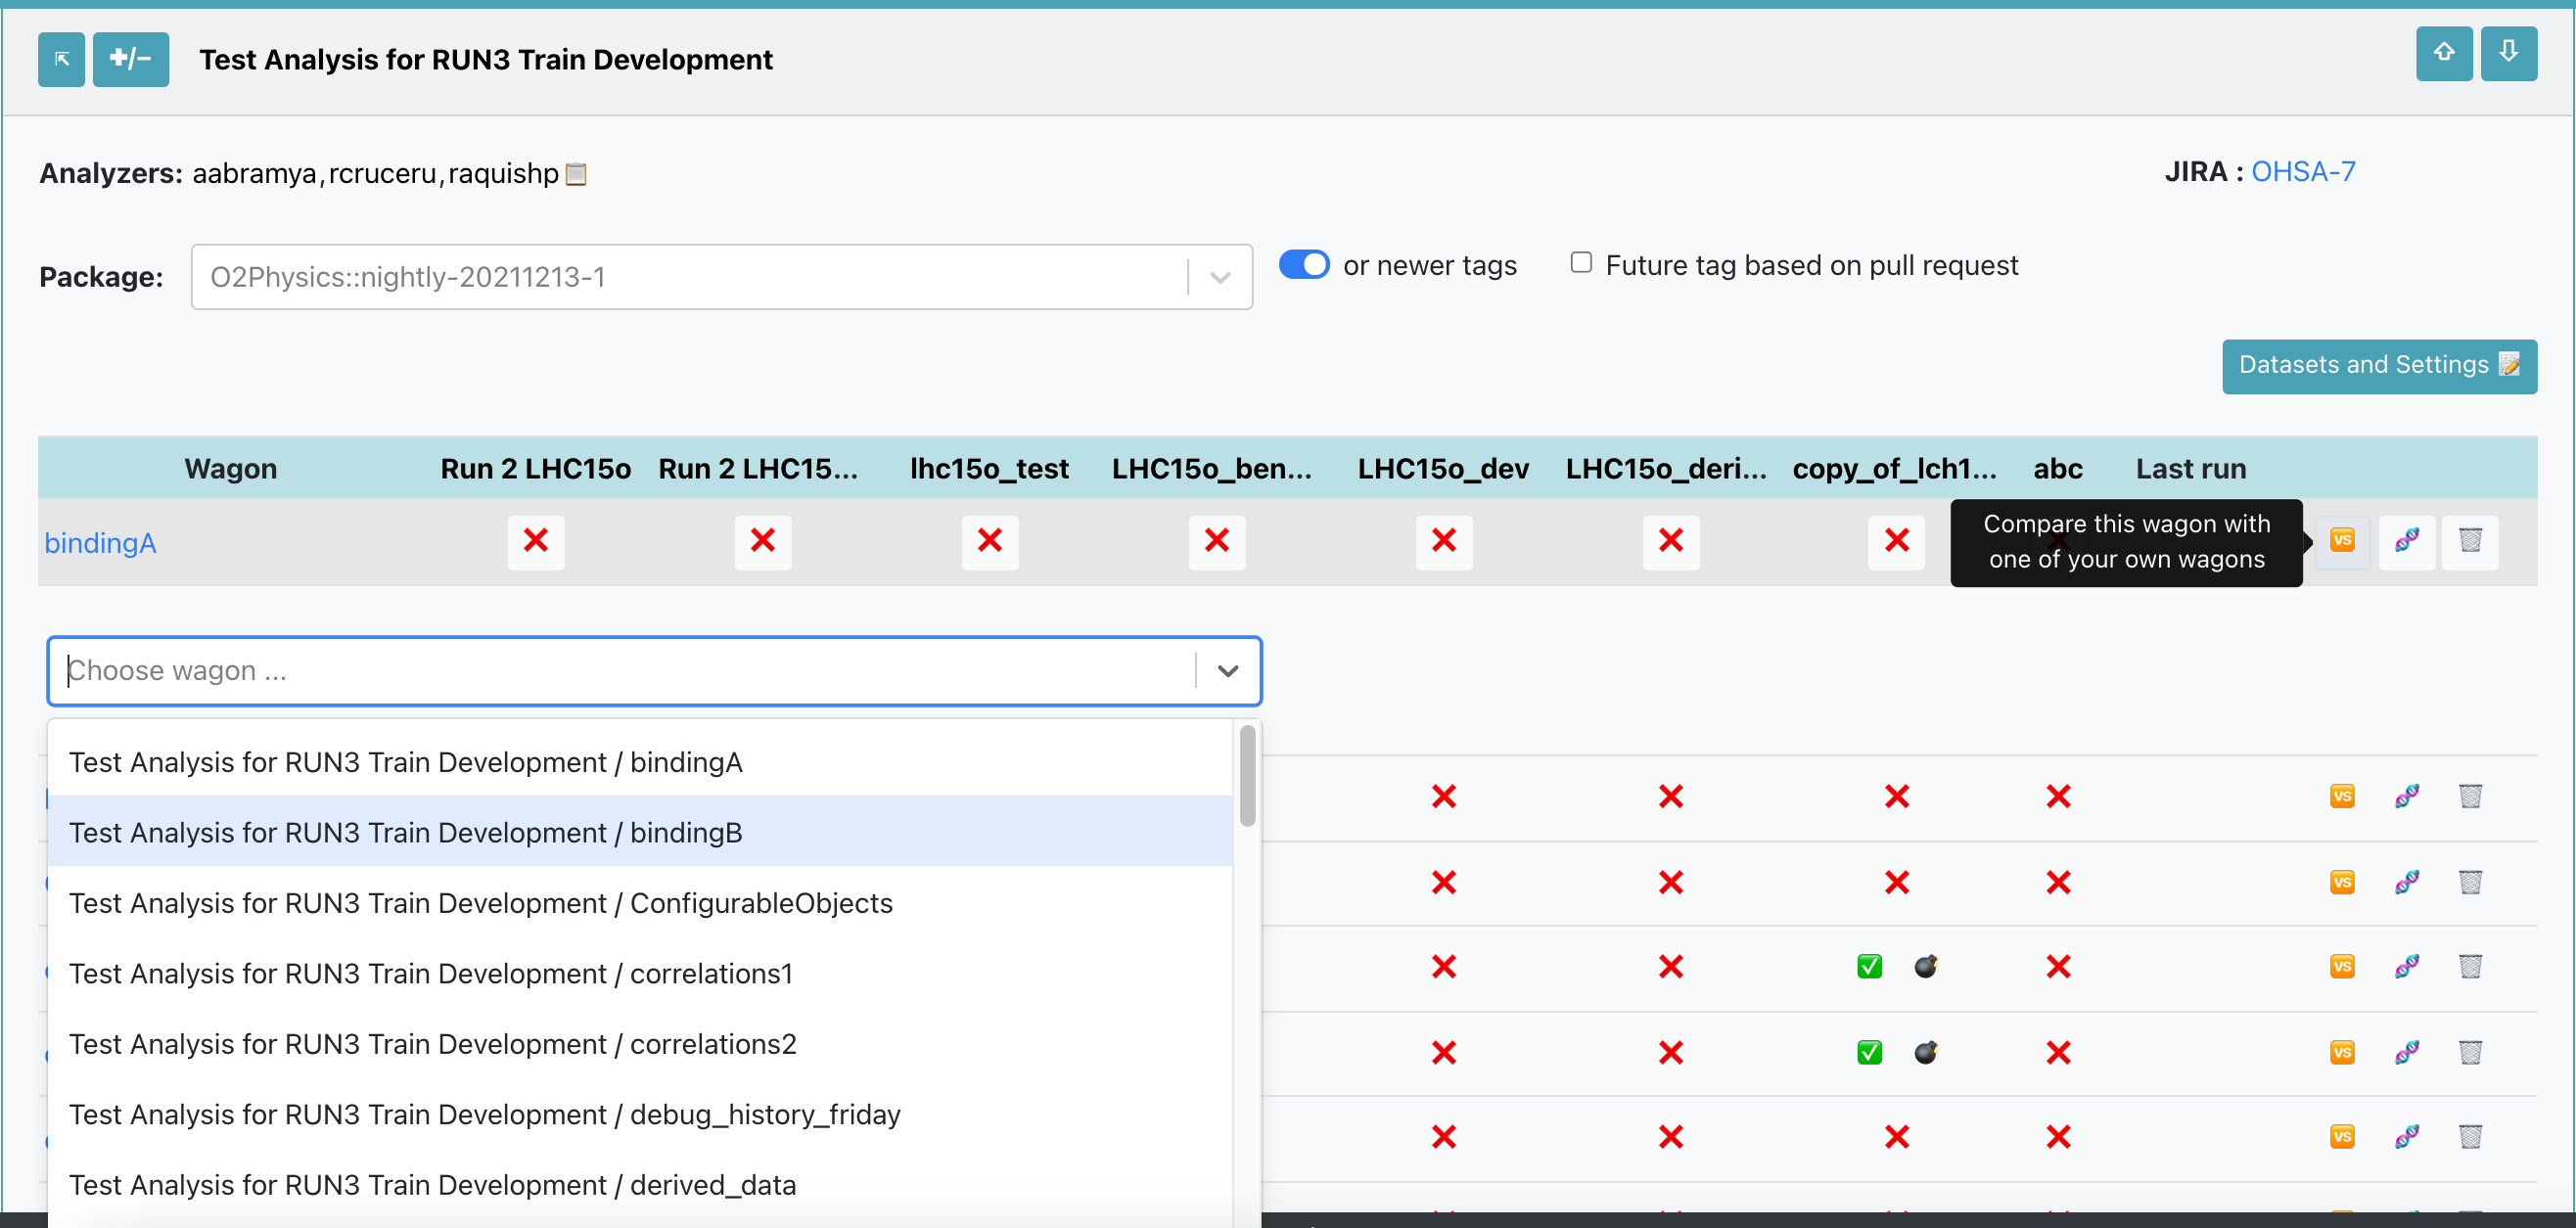
- The user is able to compare a wagon with any of their individual wagons.
- Using the My Analyses page, click on the button
🆚to compare the wagon. A list of all your wagons will be displayed. Once you select the desired wagon, this will open the comparison view in a new tab. This has a similar structure to the different timstamps comparison.
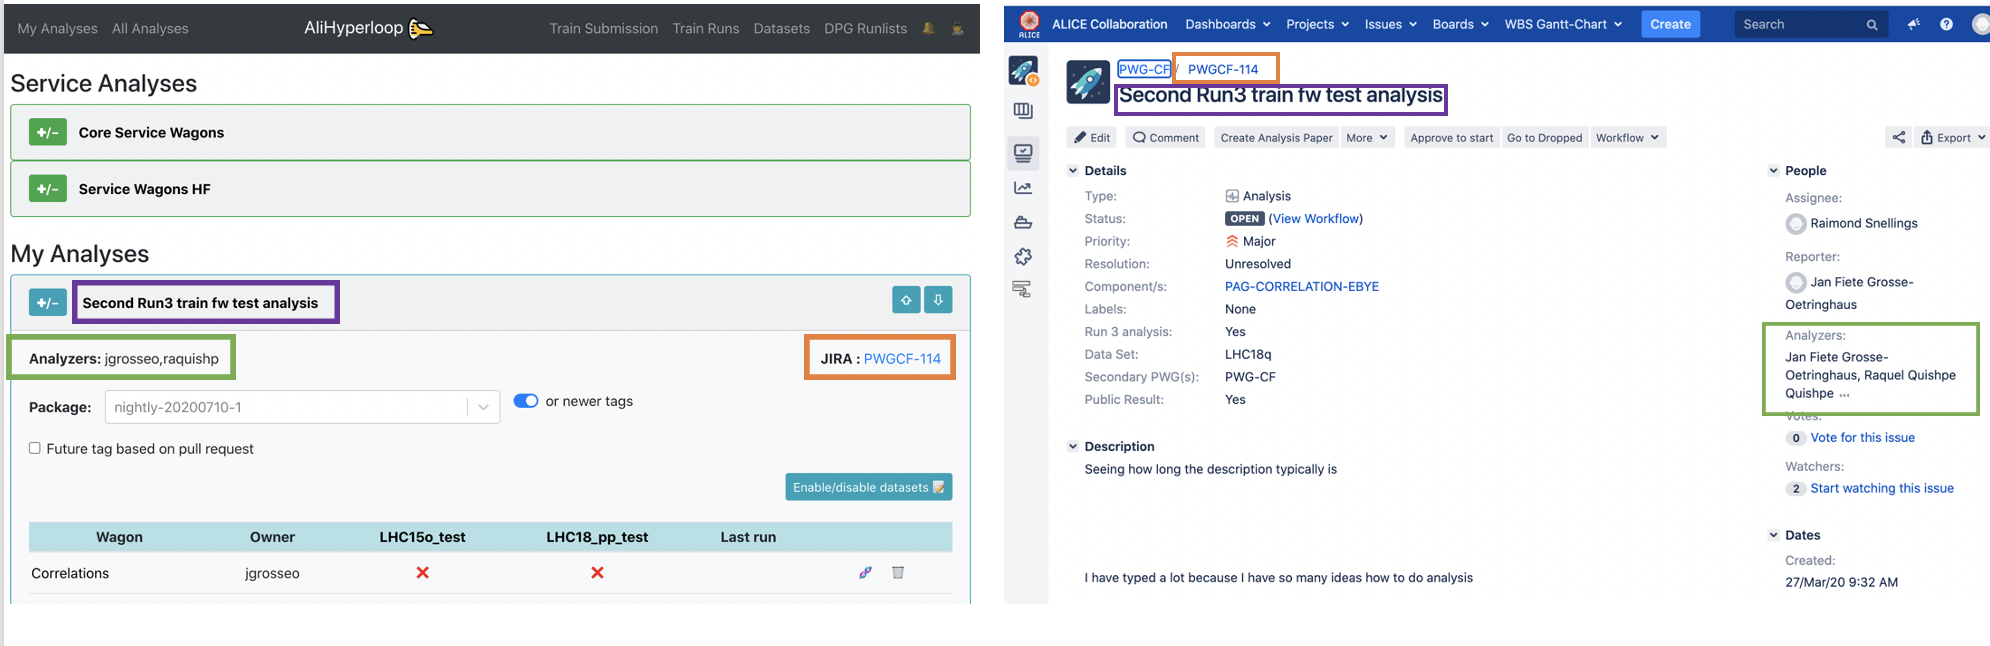
Creating or joining an analysis
The Analyses to which a user belongs to, is defined through a JIRA ticket.
In the JIRA page, create an issue by clicking on the button Create, and fill the information with the following parameters:
- In Project select your PWG.
- In Issue Type select Analysis.
- In Summary write the name of your Analysis.
- In Components select your PAG.
- In Run 3 analysis choose
Yes. - In Analyzers select all the users that will be part of this analysis. All the analyzers will have writing permits to all components in the analysis.
- (Optional) In Description give a brief description of the analysis. The rest of the parameters are not relevant for the Hyperloop train system.
After all the parameters have been set, click on Create and your Analysis will be available in the My Analyses and All Analyses page.
The synchronization from JIRA to the Hyperloop train system can take up to 30 minutes.
Enabling datasets
1. Using the My Analyses page
- Inside of an analysis, click on the button
Datasets and Settings 📝.
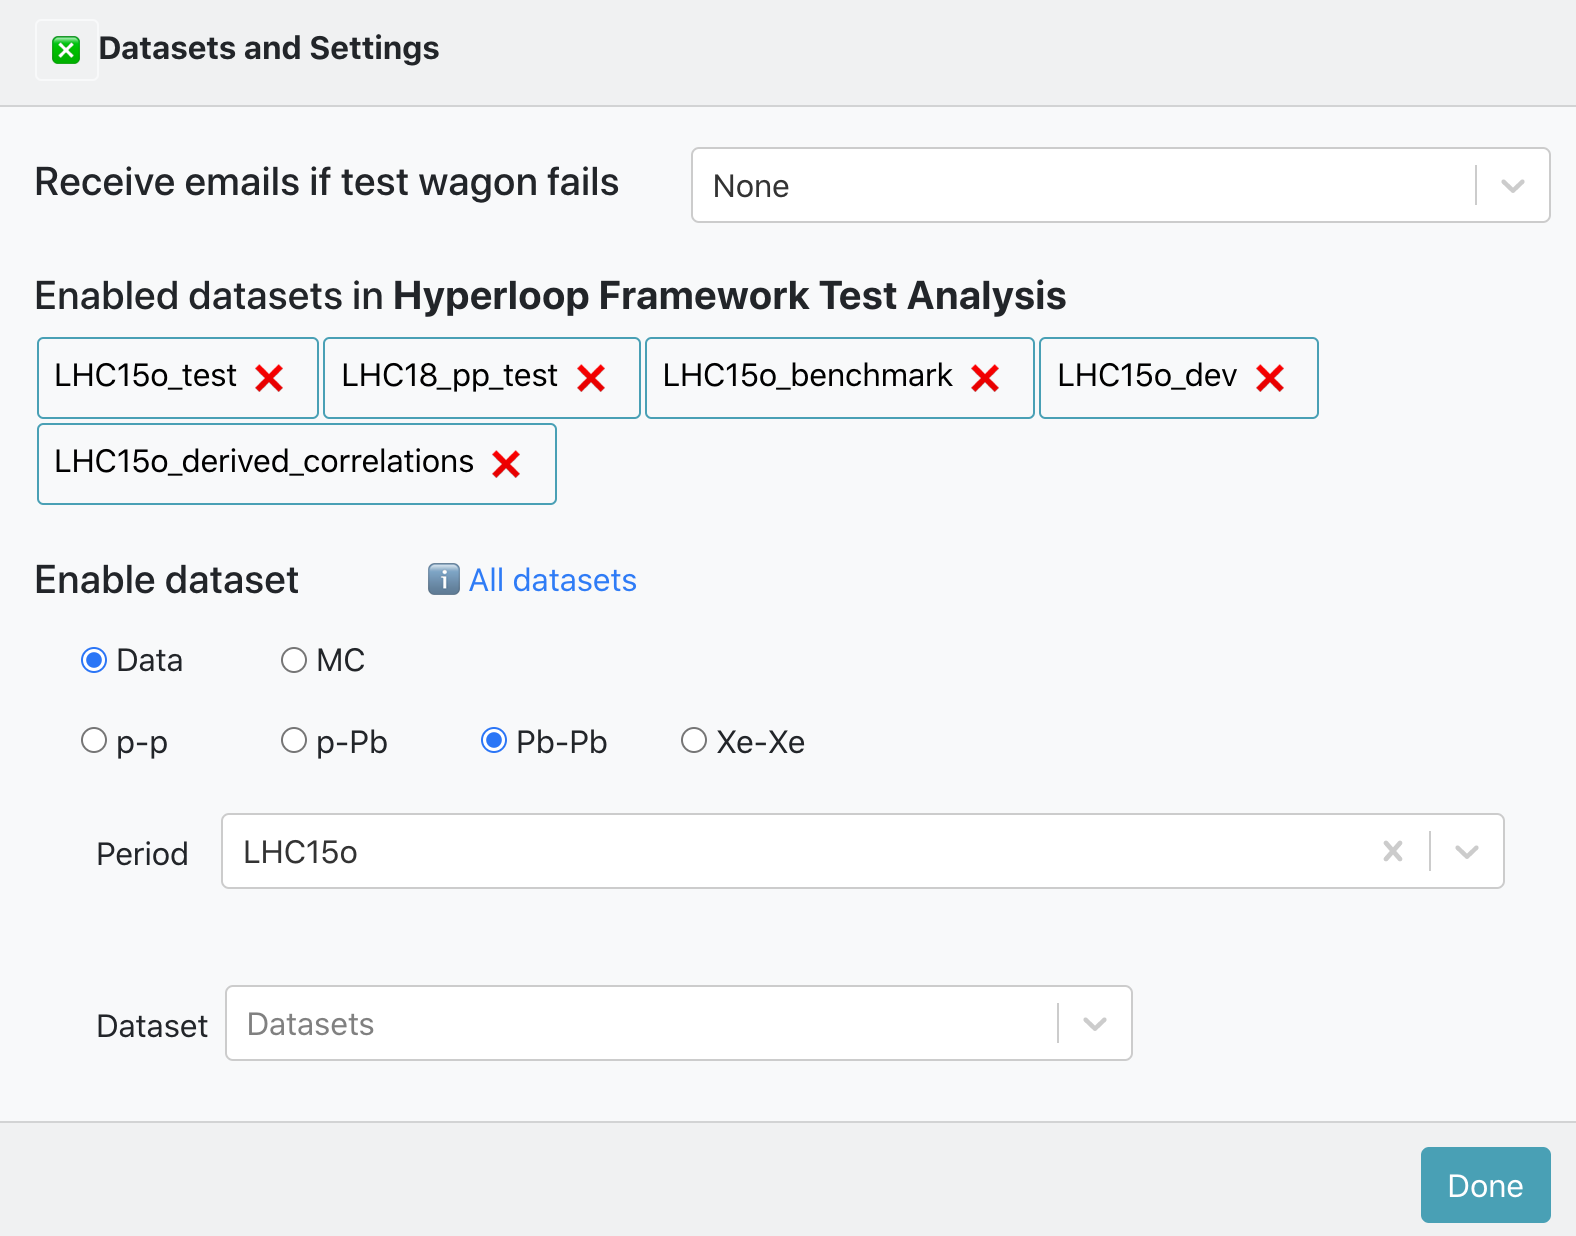
- There is a list of Enabled datasets in Analysis. You can disable a dataset for that analysis by clicking on the button
❌. - Inside of Enable dataset you can search for an active dataset by filtering by data type, collision system, anchor and period. And add it to your analysis by clicking on the button
✚ Add to analysis. Or you can click the buttonℹ️ All datasetsto be redirected to the Datasets page.
2. Using the Datasets page
- The Datasets page displays all the datasets available.
- You can browse and click on the Dataset you want to add to your analysis.
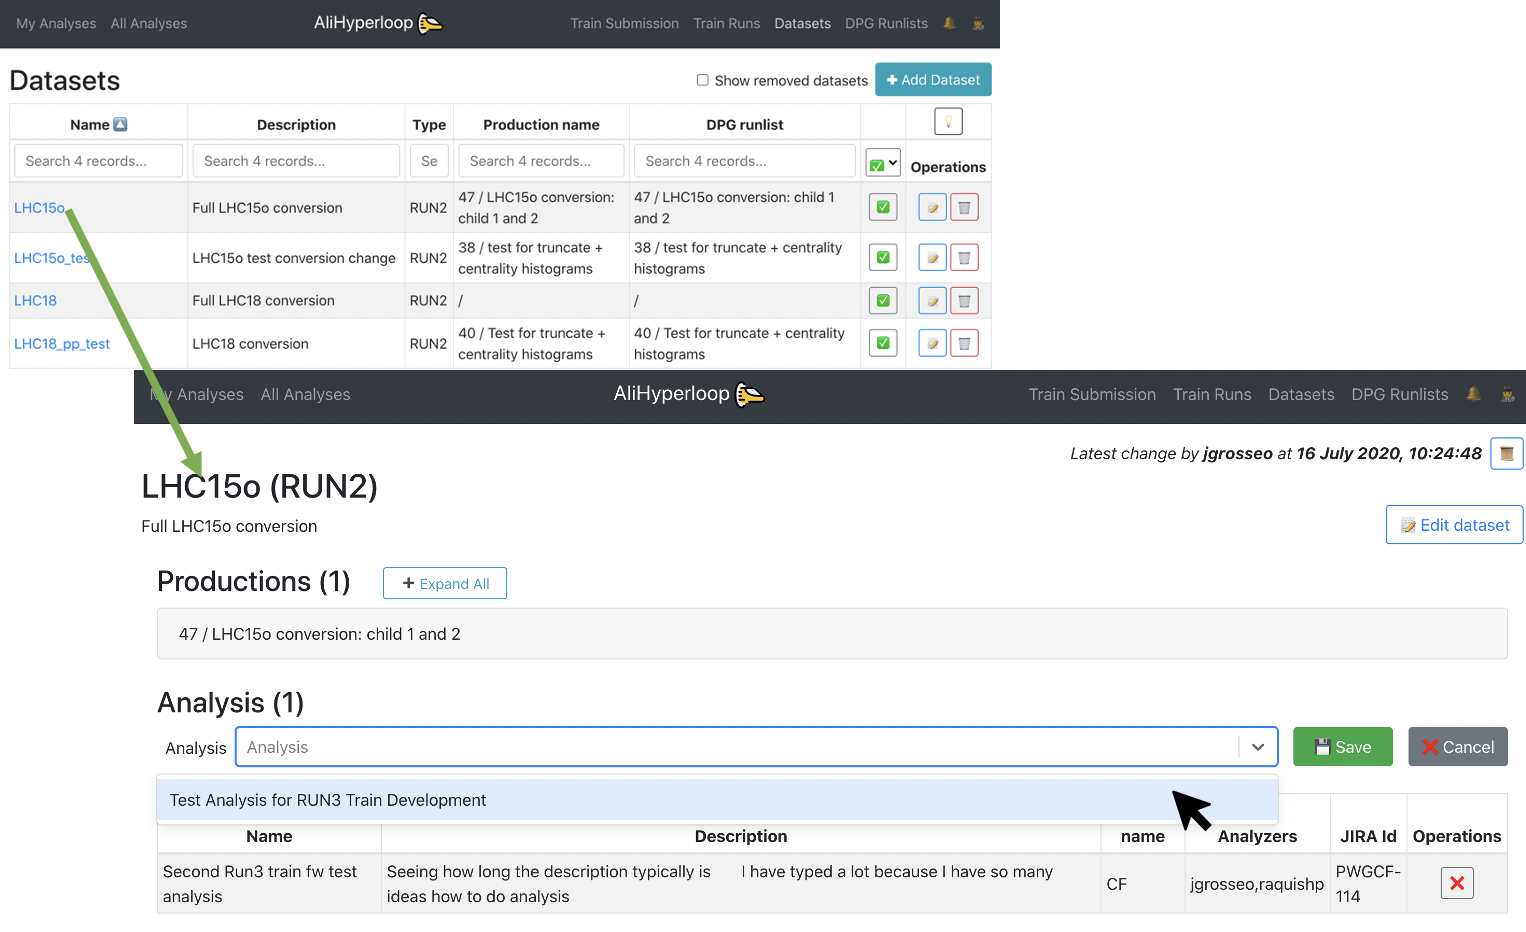
- Inside of the Dataset view page, click on the button
✚ Add dataset to analysis. It will display a list of all the analyses you belong to. Select the Analysis you want to add the dataset to, and click on💾 Save.
Enabling a wagon
You can enable a wagon in the My Analyses page. Inside of the Analysis there are the datasets available for that analysis, or you can enable/disable datasets. There are 3 options for enabling a wagon:
- Latest package tag: You can select a package tag with the option
or newer. This means that your wagon can be tested and composed in a train with the package tag chosen or the latest package tag available. - Fixed package tag: You can select a package tag and disable the option
or newer. This means that your wagon can be tested and composed in a train with that package tag only. - Pull request: Select the option
☑️ Future tag based on pull request. There will be a list of the latest merged/unmerger pull requests available with their corresponding description. By choosing a pull request, your wagon will be tested as soon as the pull request is merged in a package tag. Then your wagon will be composed in a train with the latest package tag available.
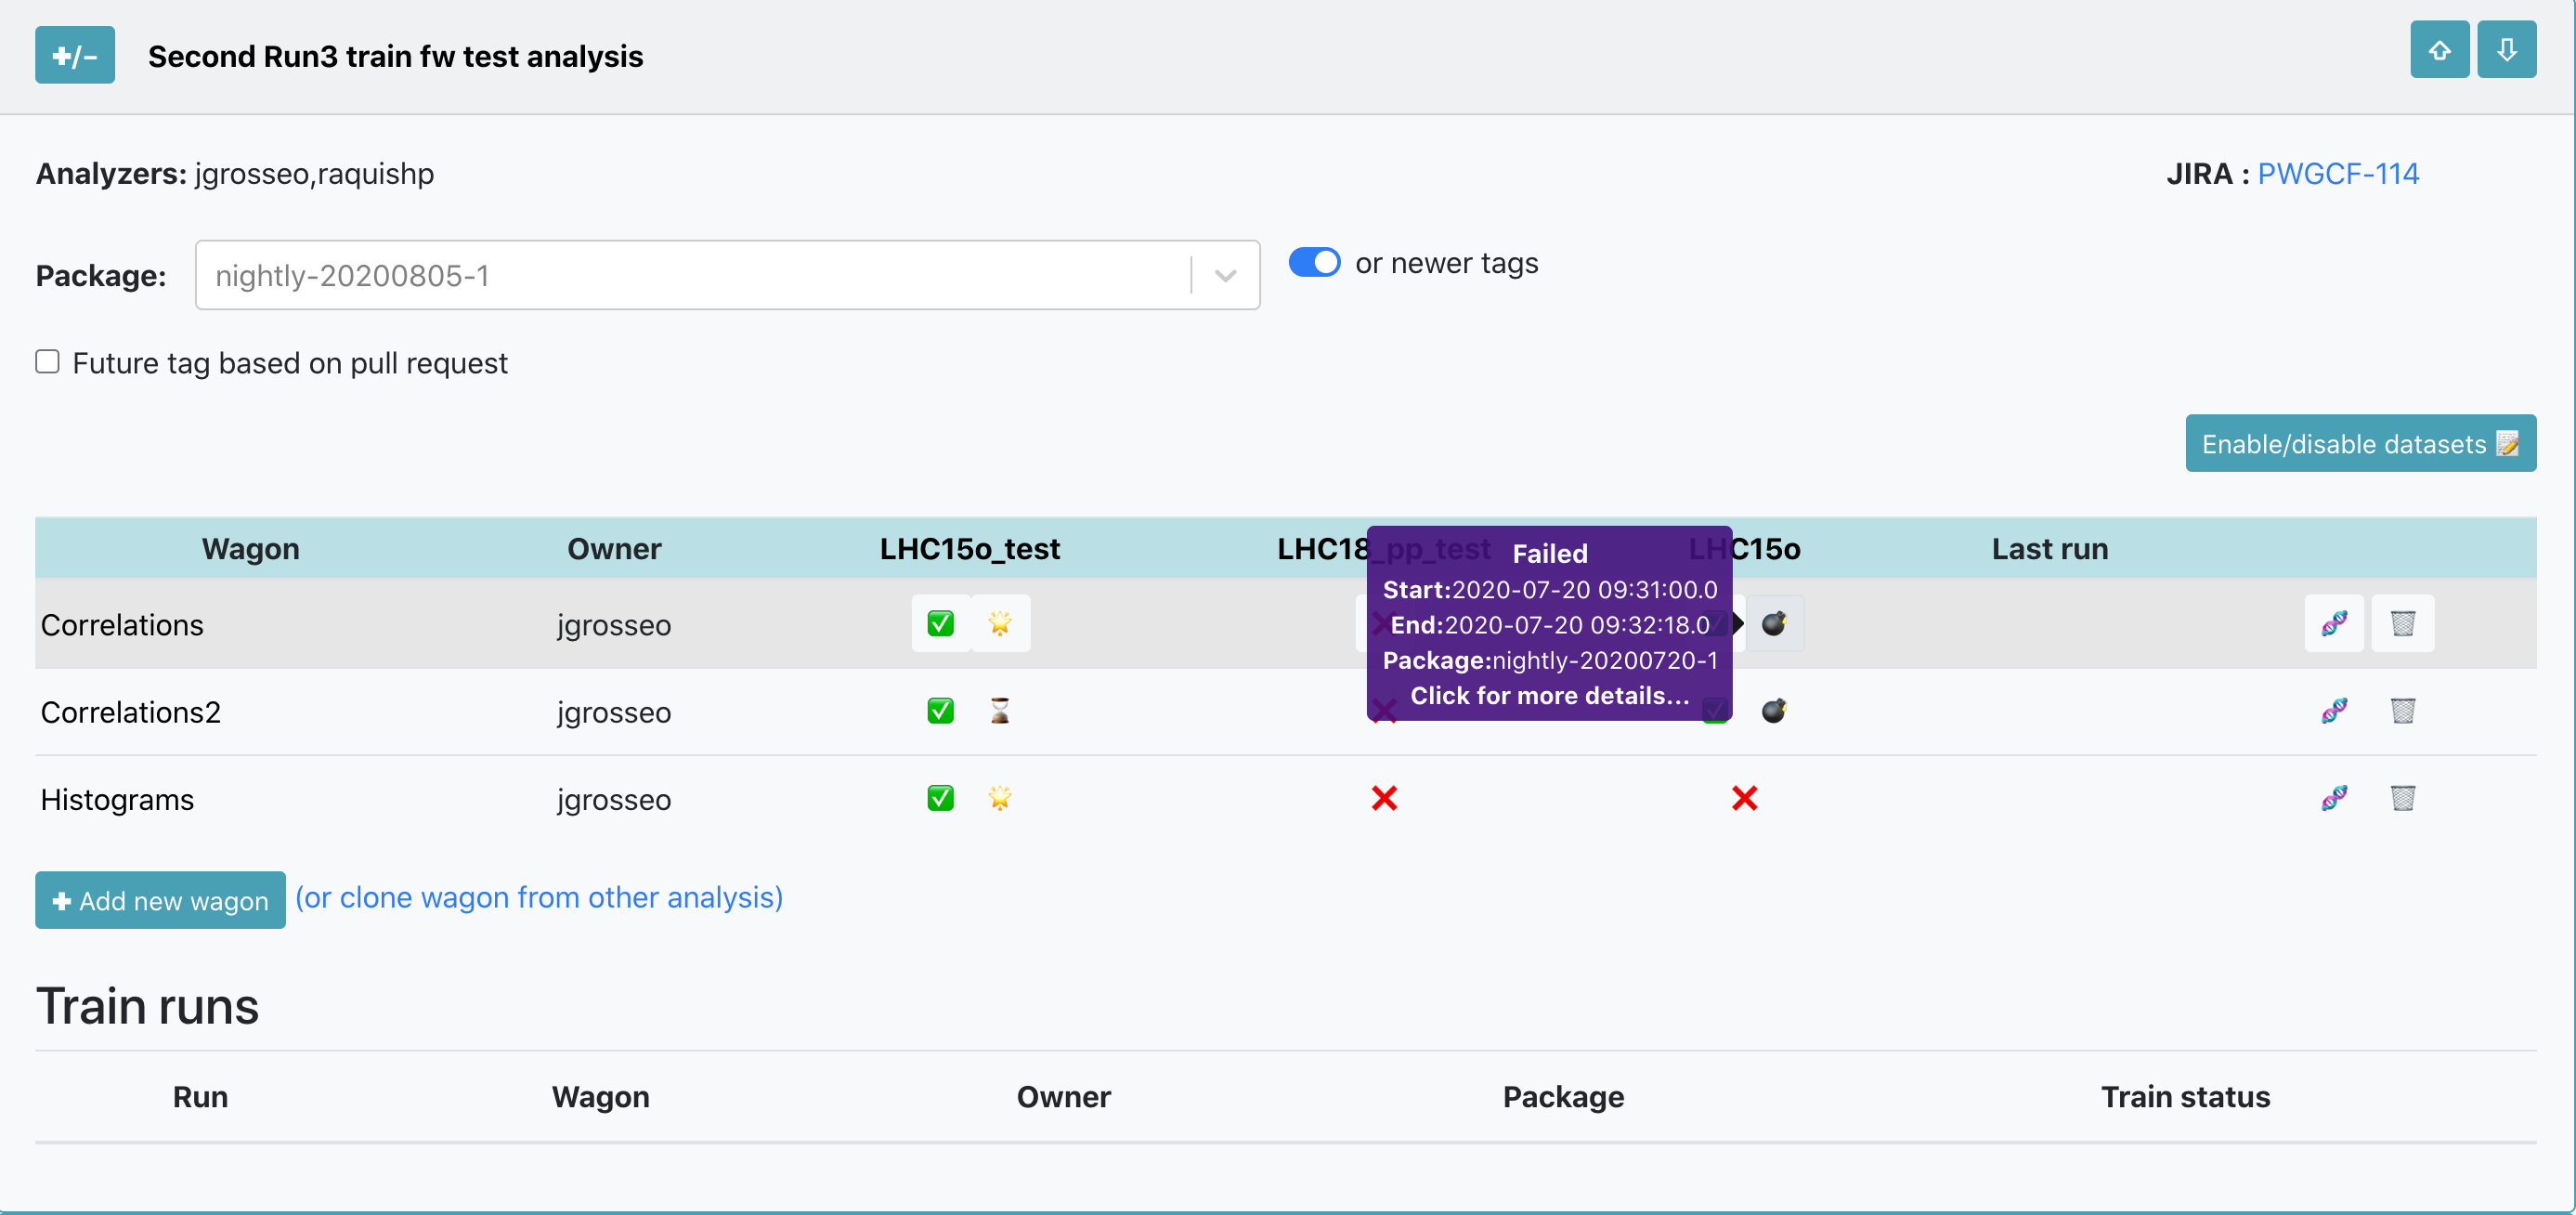
After choosing the package tag to be used, click on the button ❌ to enable your wagon in a dataset, the icon will change from ❌ to ✅. If you hover over ✅ you can see the information about the enabled wagon: package tag, time and username. If you need to disable a wagon in a dataset, click on the button ✅. After enabled, the wagon will be automatically tested and you can follow the progress of the test on the button next to ✅: ⌛️ queued,⏳ ongoing,🌟 done, ❗️ warning and 💣 failed.
If a wagon has dependencies, there is no need to enable the dependencies as well. The wagon's dependencies will be automatically tested by the system as well.
Wagon tests
- The wagon test can be accessed in the My Analyses page by clicking on the buttons:
⏳,🌟,❗️or💣. - If the TEST_ID is known, it can be directly accessed using the url https://alimonitor.cern.ch/hyperloop/wagon-test/TEST_ID.
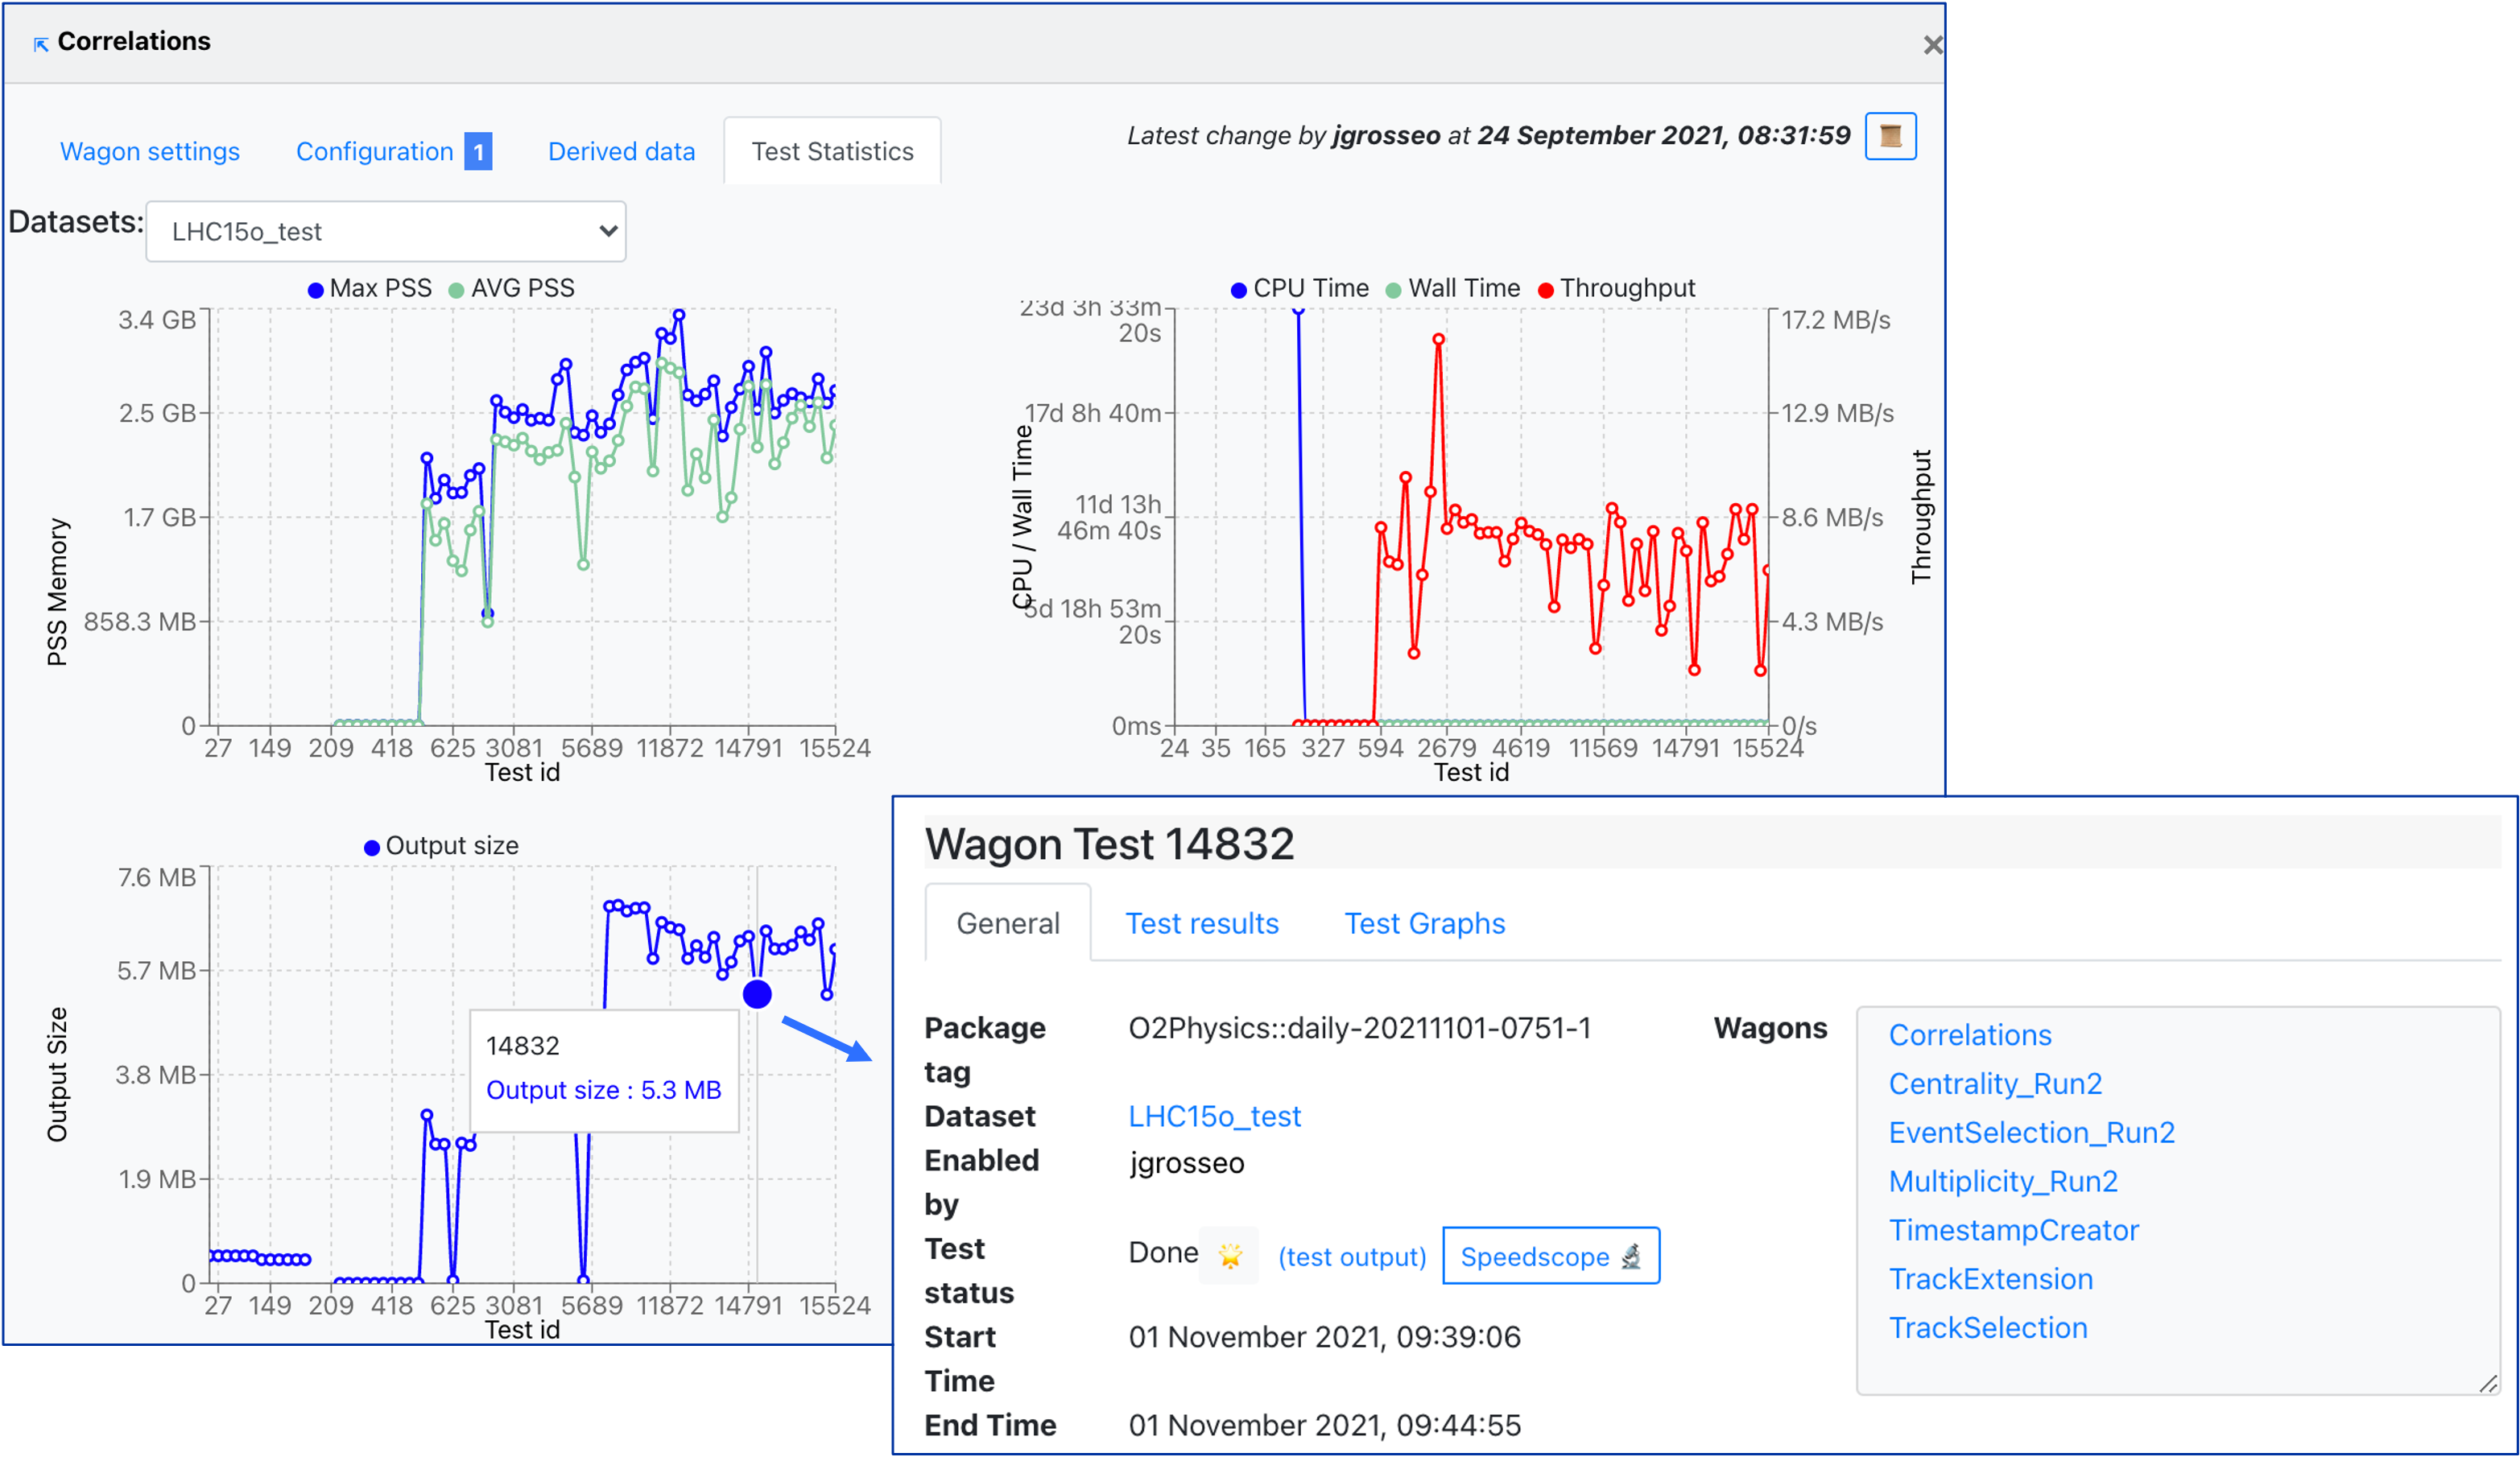
-
Inside of a wagon test, the test configuration, results, graphs and statistics are displayed.
- The General tab displays the summary of the wagon test, direct links to dataset and participating wagon configuration, as well as direct links to the test output and the speedscope profiling of the task. The test output can be accessed by clicking on the buttons:
⏳,🌟,❗️or💣, or the link(test output). - If a wagon test has failed, one can study the failure source by clicking the test output button. This will open in a new tab the list of files that can be used to track the possible issues that led to the failure.
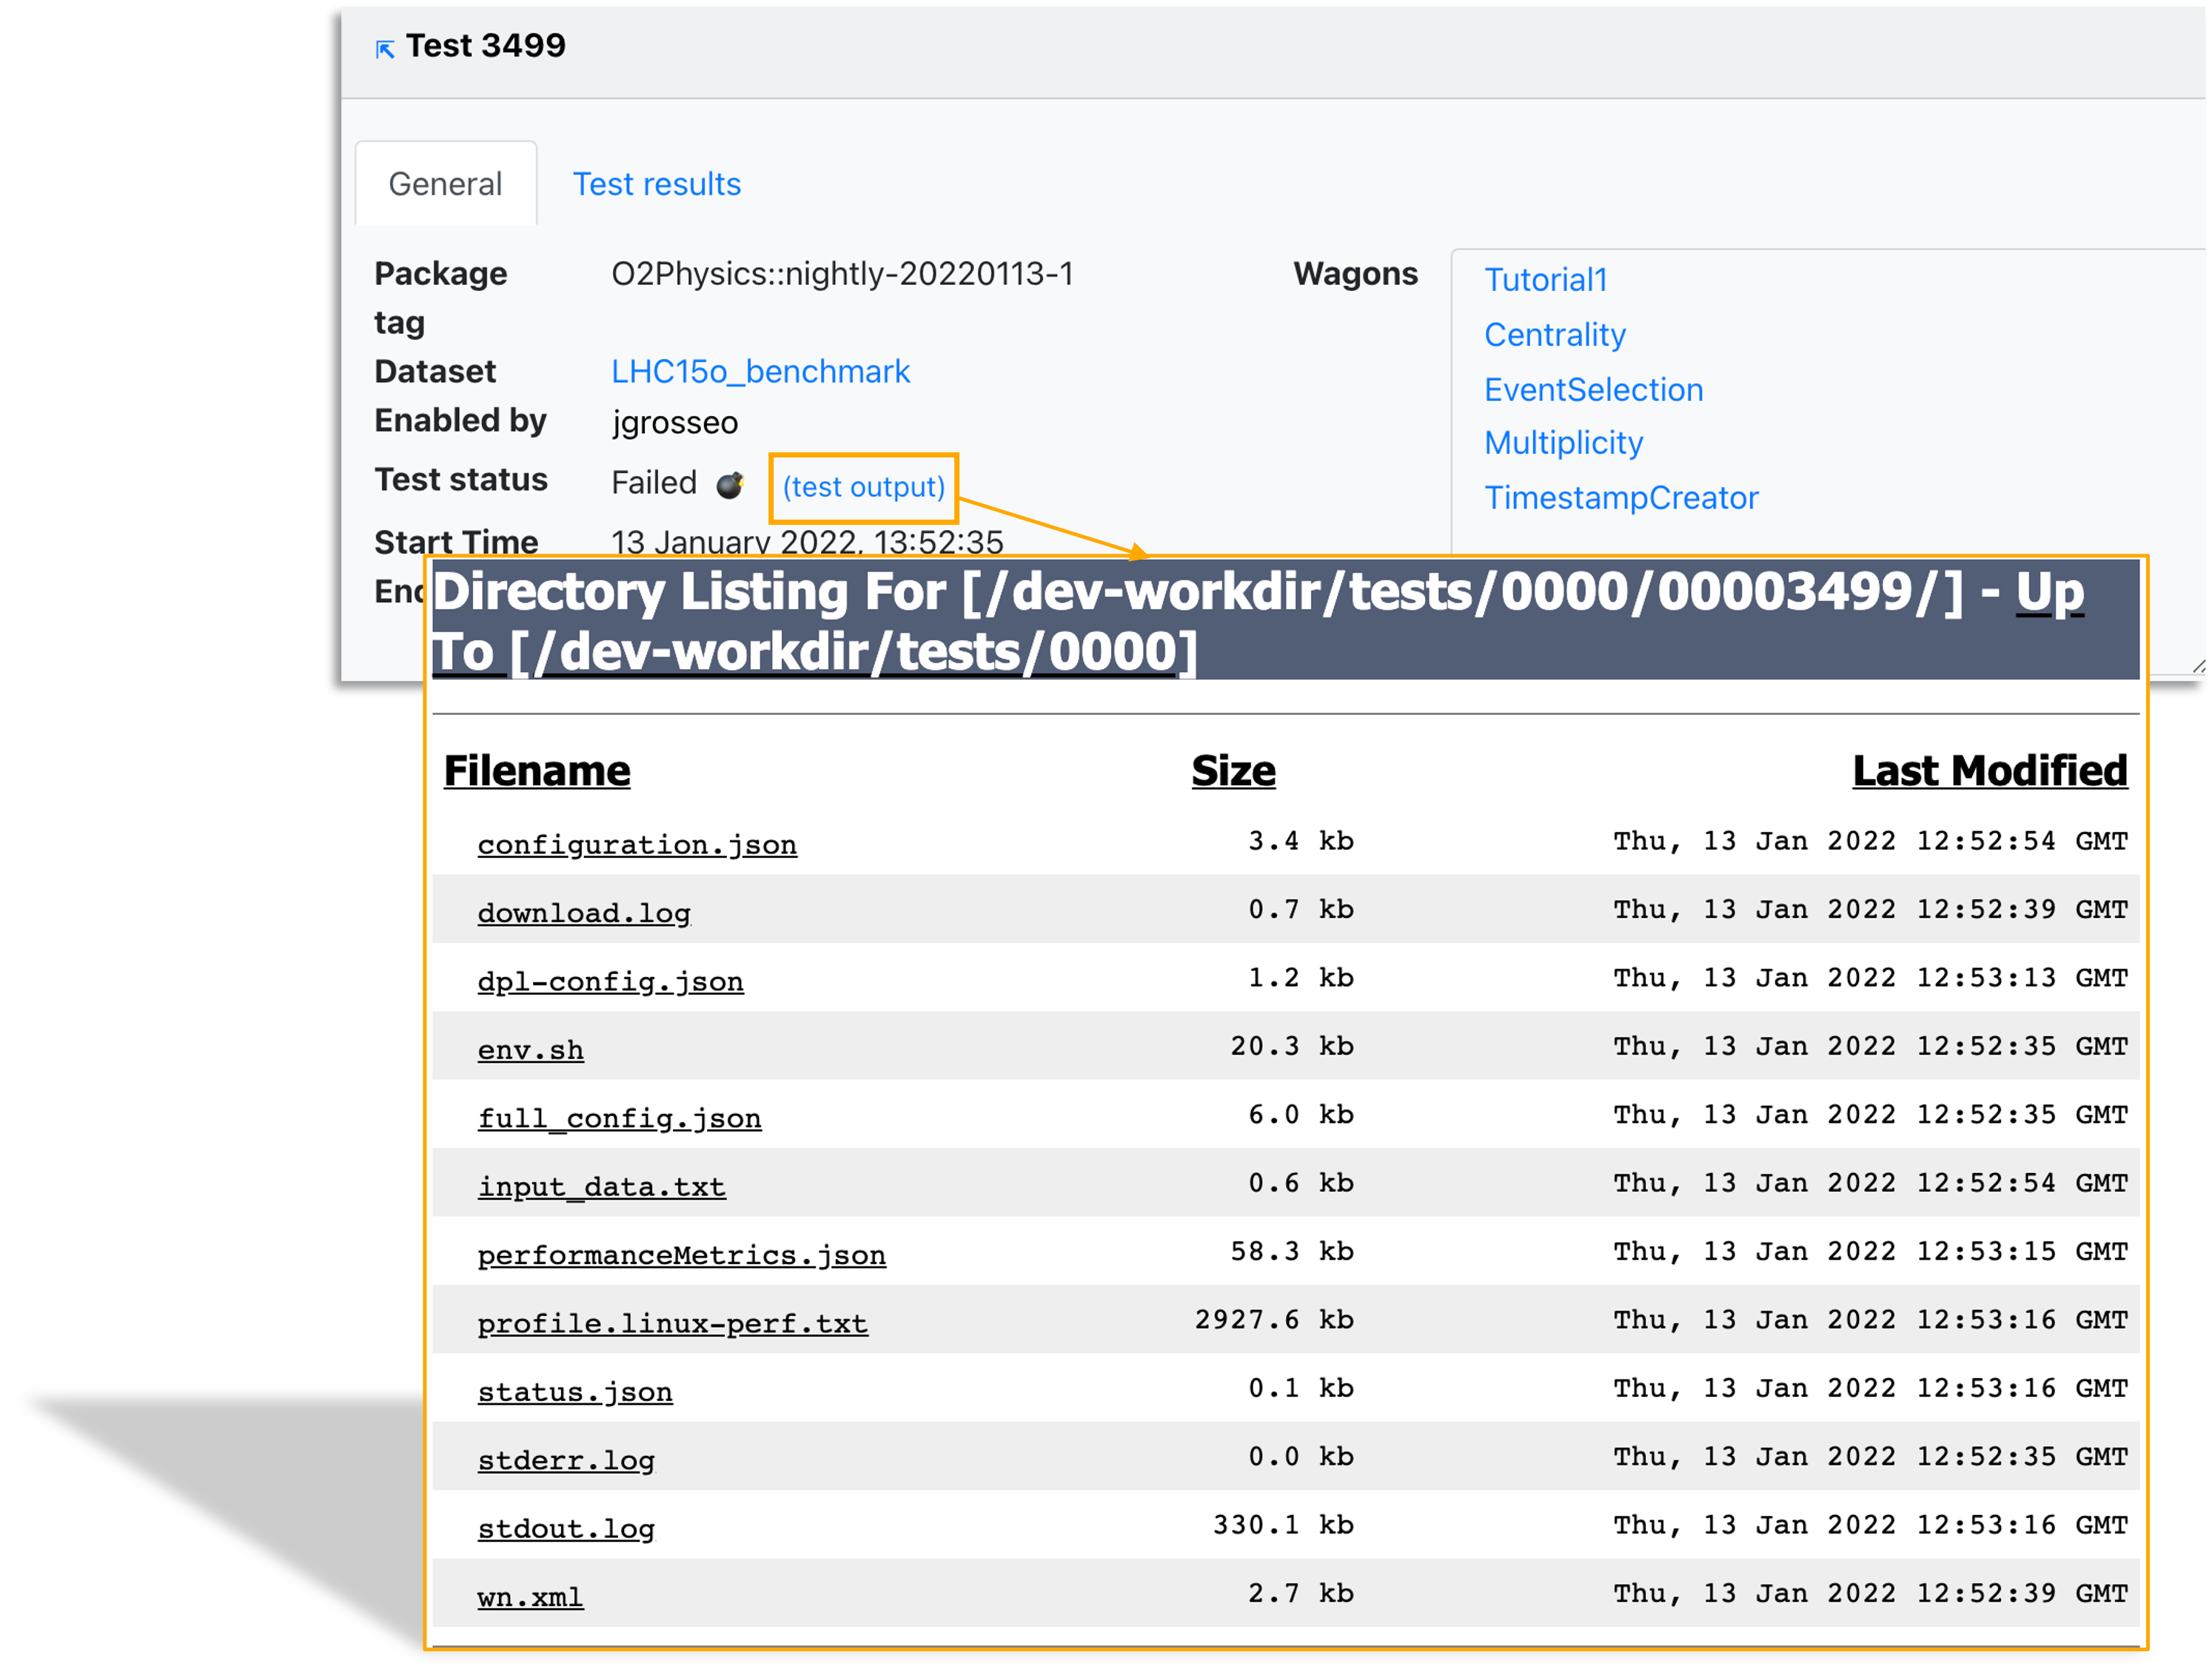
- You can analyse:
- Full configuration
- Performance metrics
- Status
- Standard error
- Standard output
- Test results tab
- The Test results tab shows the performance metrics per device (reader, workflows, writer), along with the expected resources. You can use the interactive graphs (per device) to zoom into the area of interest (click and drag) or zoom out (double-click).
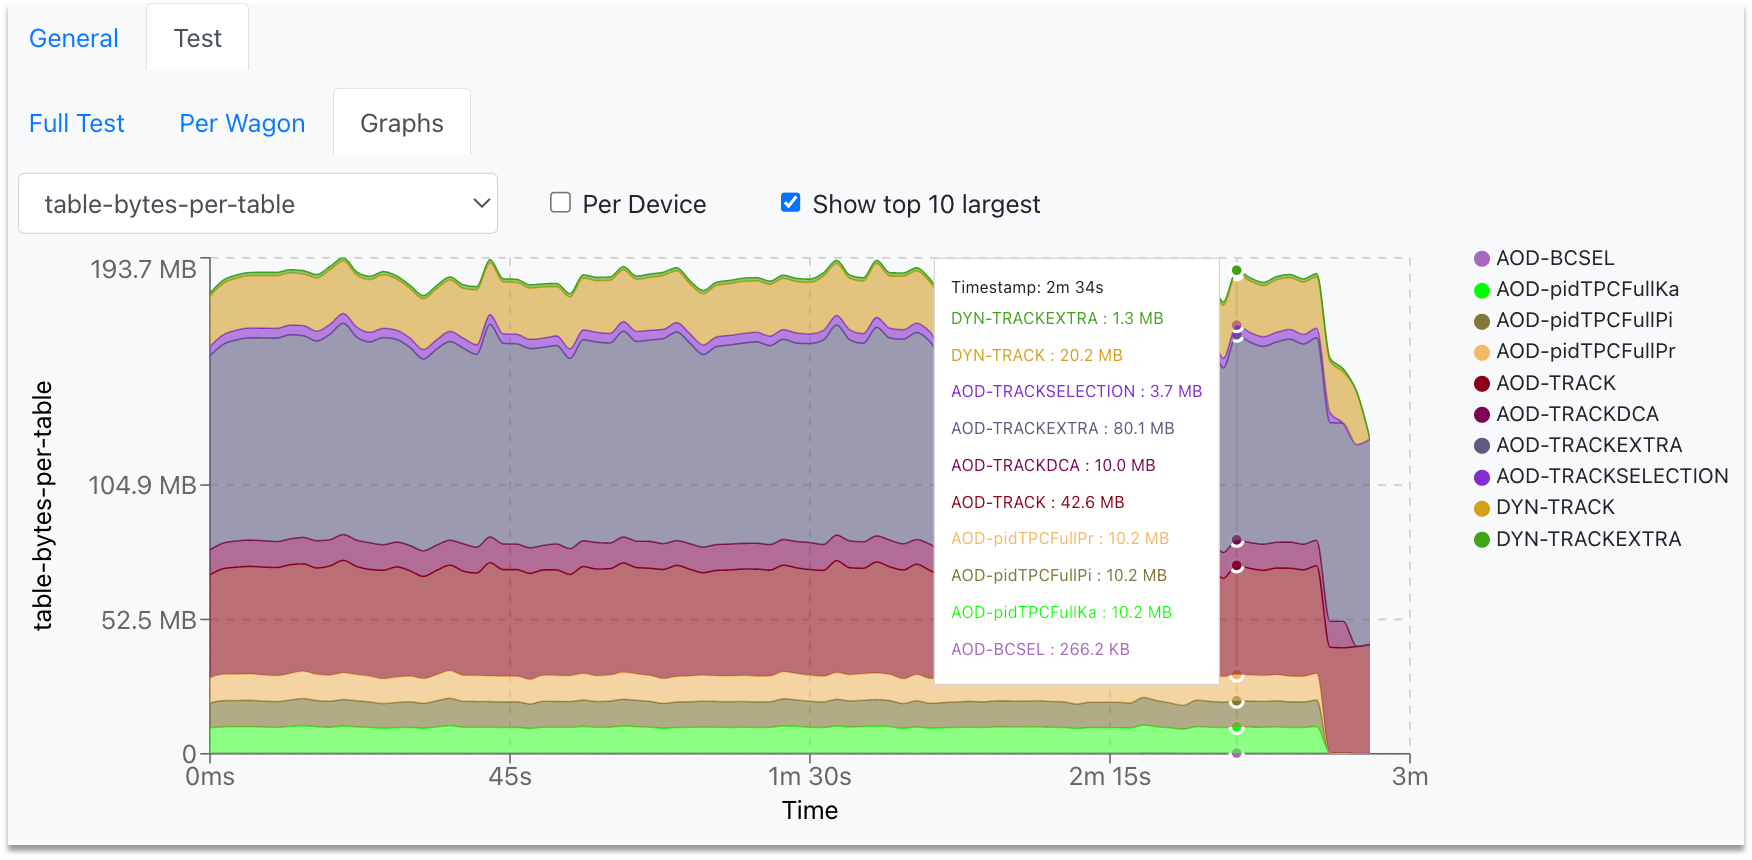
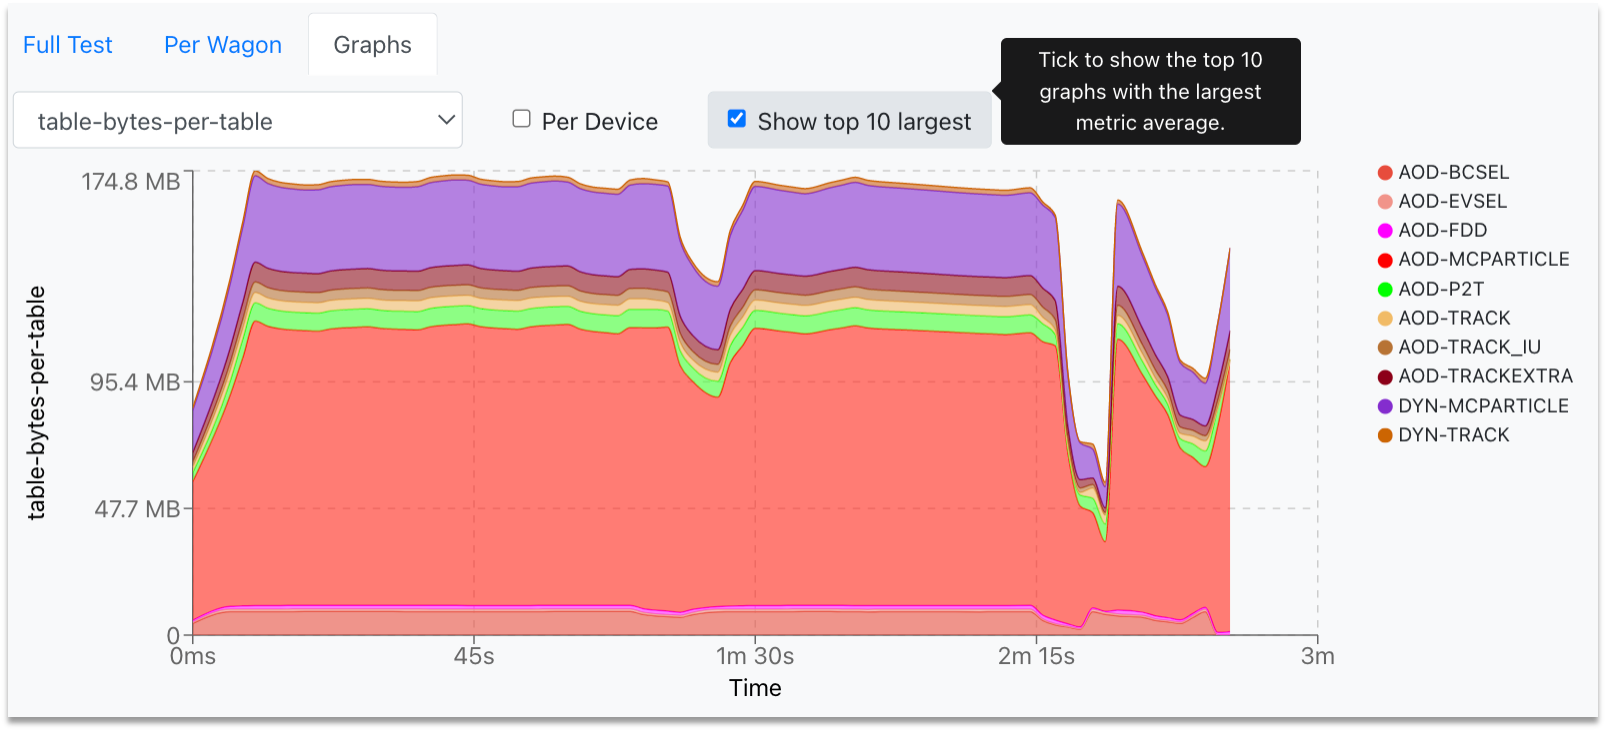
- The Test Graphs tab, plots the available metrics for the specific wagon test. You can choose the metric of interest from the dropdown, zoom into the graph (click and drag) and zoom out (double-click).
 //already there
-
If you only want to see the top 10 graph with the highest average, check the Show top 10 largest box.
-
To produce this type of performance graphs for a local O2 execution, follow the instructions here.
-
Whenever a wagon configuration is changed, if there are enabled wagons (including wagons that depend on it), then the test is automatically reset and a new test is launched. However, if the enabled wagon was already composed in a train, the train will run with the wagons and dataset configuration of the time at which the train was created.
Relation of pull requests
When creating or enabling wagons, you can use a pull request instead of a package tag. By doing this, you don't need to wait until your code has been merged and released in a package tag.
- Adding a new wagon: You can create a wagon with your unmerged or unreleased workflow. If the workflow is not available, add manually the configuration of the wagon, and subwagons if needed. You can synchronize the wagon's configuration once the package tag that includes your pull request has been released.
- Enabling a wagon in a dataset: If you need to enable your wagon with workflow that is unmerged or unreleased, use a
Future tag based on pull request. There is a list of the latest merged and unmerged pull requests available in the system, you can see the pull request number and description. Select the pull request tag and enable the wagon in a dataset. By doing this, the wagon will be queued to test, and the test will begin once the pull request has been merged to a package tag, and the package tag is released. And then, if the test is successful, it'll be composed in a train with the latest package tag available.
Warnings
When a wagon test finishes in warning, this means that the wagon will not be included in the automatic composition schedule. Therefore, train composition can be requested in the Operation channel, where an operator will take care of the request. Before doing so, please review if you cannot fix the cause of the warning yourself. Depending on the nature of the warning and the degree of exceeding specific constraints, the operator will either compose your train or advise you to review and improve certain parts before requesting a train again. In the latter case, the user can analyze the test and review the logs, searching for ways of improving resource usage or other elements that caused the exceptions.
There are a number of warnings, which will require different courses of action:
1. Memory consumption too large for automatic train submission
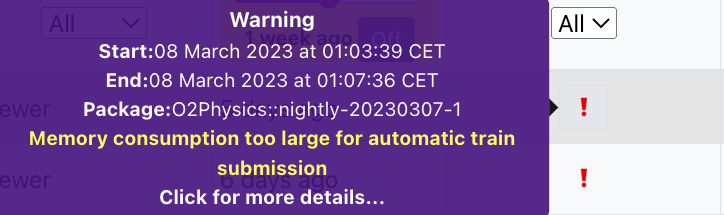
- The memory consumption is larger than the limit. In wagon tests, the limit is the memory allowance of a two core target minus a small buffer, which is ~ 3.6GB.
-
In the train test, the limit is the memory allowance of the train target. For Grid - Single core and 2 core, trains may be submitted even with the warning: If the average PSS memory is <= 3.2 GB, then operators will compose your train on Grid - Single core. Otherwise, if it is > 3.2 GB and <= 4 GB, the operators will compose the train on request on Grid - 2 core. If larger than 4 GB, then the train cannot be composed. The user should check for ways of improving memory consumption.
- For the other target queues, trains can only be composed if the memory consumption is within the target limits.
- For the cases when the train cannot be composed due to high memory consumption, the user can review the test. One can check the logs and look for any possible improvements that can be done for a lower memory consumption.
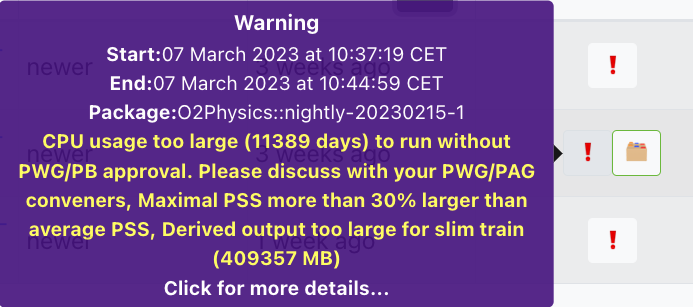
2. Maximal PSS more than 30% larger than average PSS
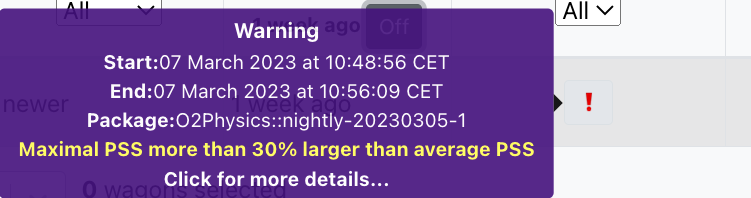
- The maximum PSS memory consumption is more than 30% larger than the average PSS, therefore the train cannot be automatically composed. This warning means that a memory leak is possible, so it must be checked by an operator. If there is no memory leak, the train can be composed. Otherwise, the operator will advise the user to check for possible causes and improvements before requesting again.
3. CPU usage too large
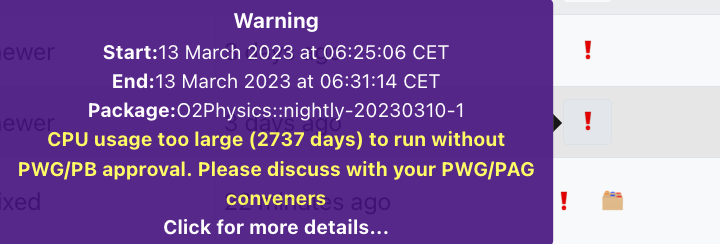
- The CPU usage limit is set per dataset and all trains running on a specific dataset must respect this constraint. If the limit is not respected, the train cannot be composed without PWG approval. Therefore, the user should discuss the details and requirements for this train with the PWG before requesting again. Depending on the amount of total resources, an approval in the Physics Board (PB) may also be needed. The CPU limit of a dataset may be viewed on the dataset page.
- It is possible for a train to have a CPU warning when composed despite the wagon test not having a CPU warning. This usually happens in a situation where the wagon test (which runs on a single core) uses so much memory that it doesn't fit a single core job on the grid and therefore needs two cores for the train (more cores means a higher memory allowance). But if the devices in the wagon cannot be parallelised well over multiple cores, this leads to more wall time and a higher CPU usage as the cores will be underutilised. In this situation, one can either reduce the wagon memory consumption to fit into a single core or reduce the CPU consumption to fit the dataset.
4. Too many CCDB calls
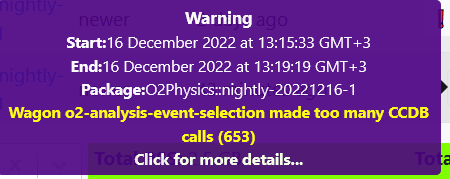
- Too many calls to the CCDB, therefore the train cannot be composed, and the cause of a high number of calls should be checked.
5. Reduction factor too small
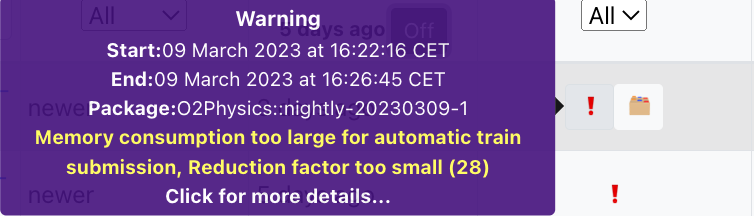
- This occurs when the reduction factor is lower than 50. If the expected output size is below 50 GB, the operator can compose the train on request. If larger, the train cannot be composed.
6. Log output too large
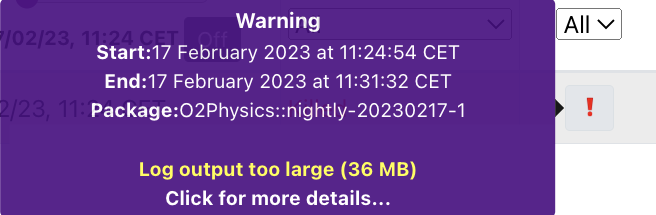
- The log file is too large, therefore the train cannot be composed, and the user should check for factors leading to this.
7. Derived output too large for slim train
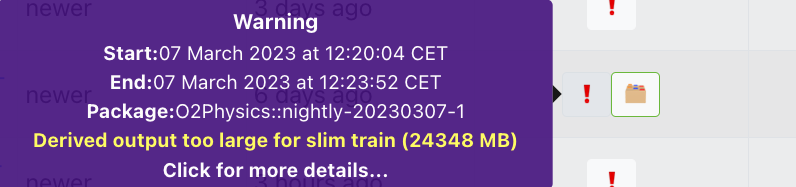
- This is specific to tests with wagons set as ready for slim derived data. As the entire output is merged into one single file, there is a limit of 4000 MB for this. If exceeded, the user is advised to switch to standard derived data by unchecking the option "Ready for slim derived data" in the wagon edit view. Then a request for standard derived data train can be made.
8. Unbound indices detected in AO2D merging
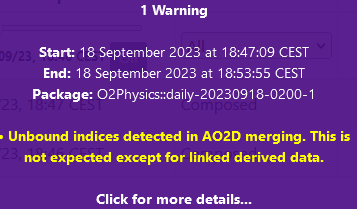
- For derived data trains, it notifies the detection of unbound columns during AO2D merging. This means that one of the output tables which has been asked to be stored has index columns to tables which are not within the output. This usually points to a bad or broken data model definition and should be fixed. The only case where this is expected and not worrisome is linked derived data. For both slim derived data and standard derived data, the data model should be fixed.
9. Too many input files expected to go to derived output
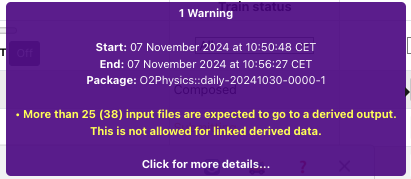
- This warning only appears for linked derived data. The maximum number of input files which can go to derived output is 25. The warning will display how many are expected. If this warning appears, the train cannot be submitted.
Multiple warnings
It is possible that a wagon test or train test will produce multiple warnings. In that case, the checks above will be done for each warning present, and the decision making regarding train submission will be done considering all the exceptions.
All Analyses
- All Analyses is a read only view of all analyses available in the system. Click on the analysis name to be redirected to a read-only view of the analysis.
- Wagons from any analysis available in the system can be cloned
🧬to a user's analysis.
Train Runs
-
For a user, the Train Runs page displays a read view only of all train runs available in the system. The derived data column shows if a train is an analysis train (empty), standard derived data train (🗂️) or slim derived data train (green bordered 🗂️). The difference between standard and slim derived data trains is explained above.
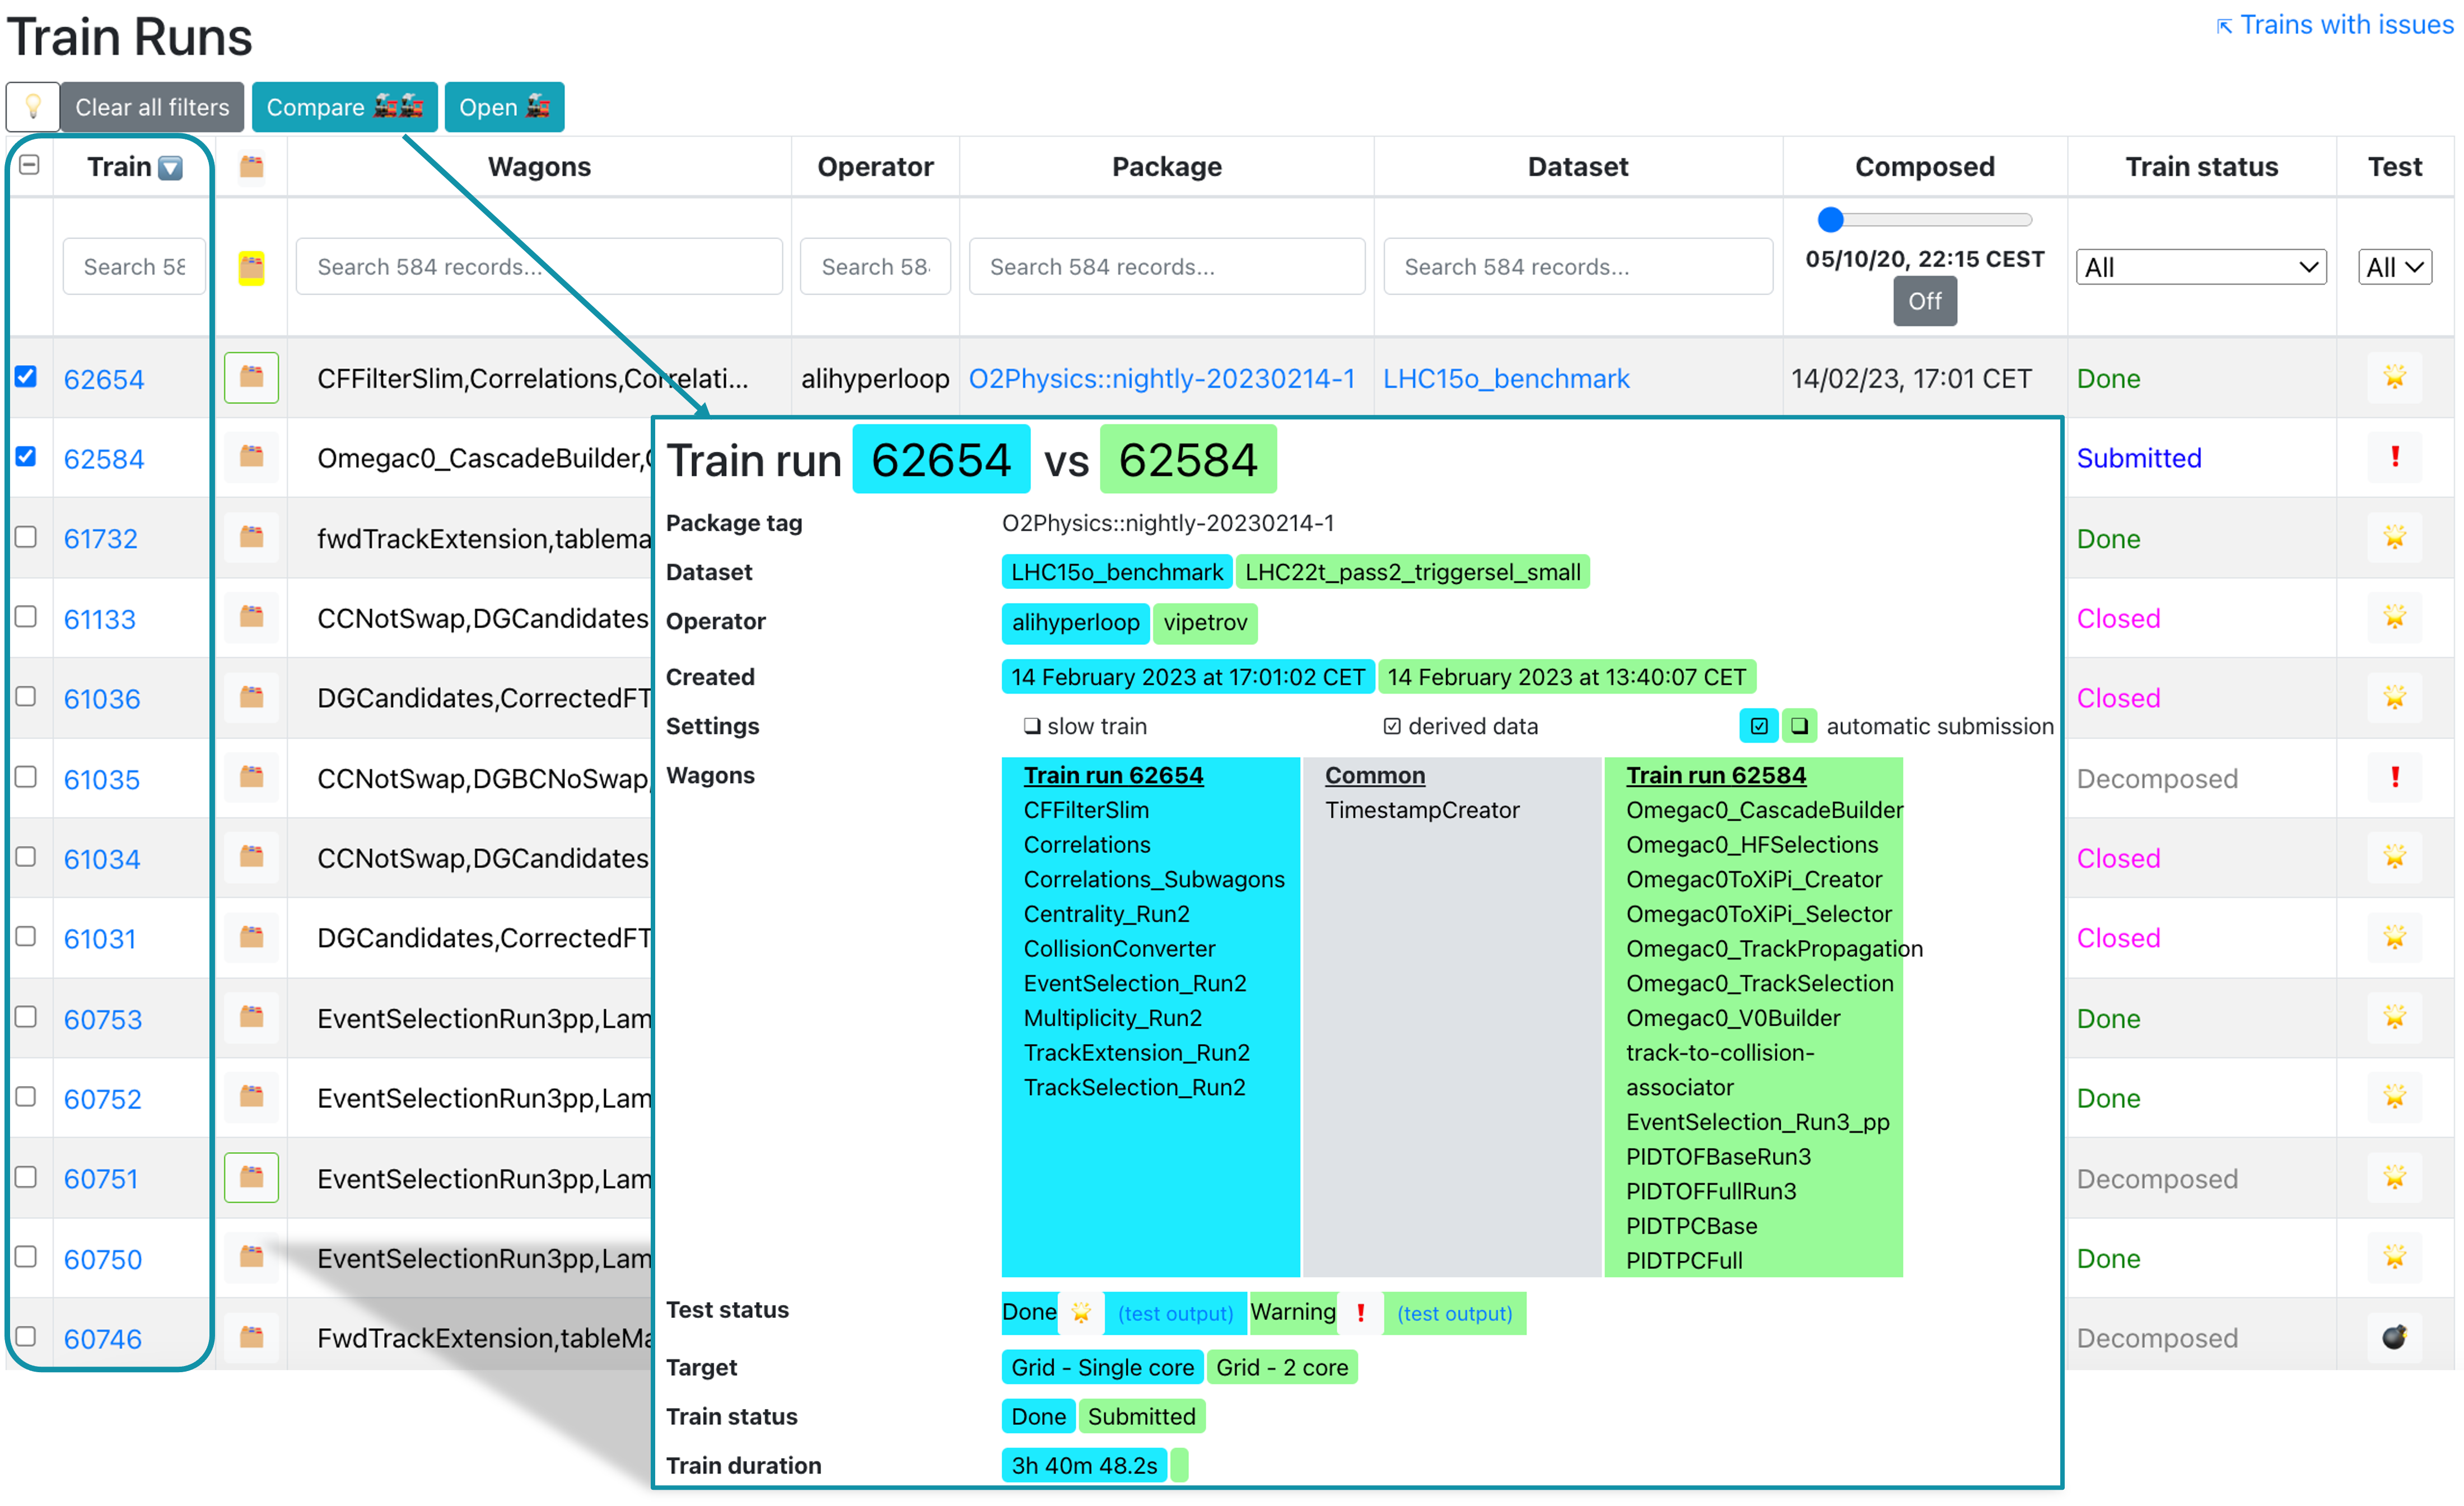
-
To compare two trains, select them in the Compare column and click Compare. This will open a new tab displaying the differences between the two trains.
- The train run result can be accessed by clicking on the TRAIN_ID, or with the url https://alimonitor.cern.ch/hyperloop/train-run/TRAIN_ID.
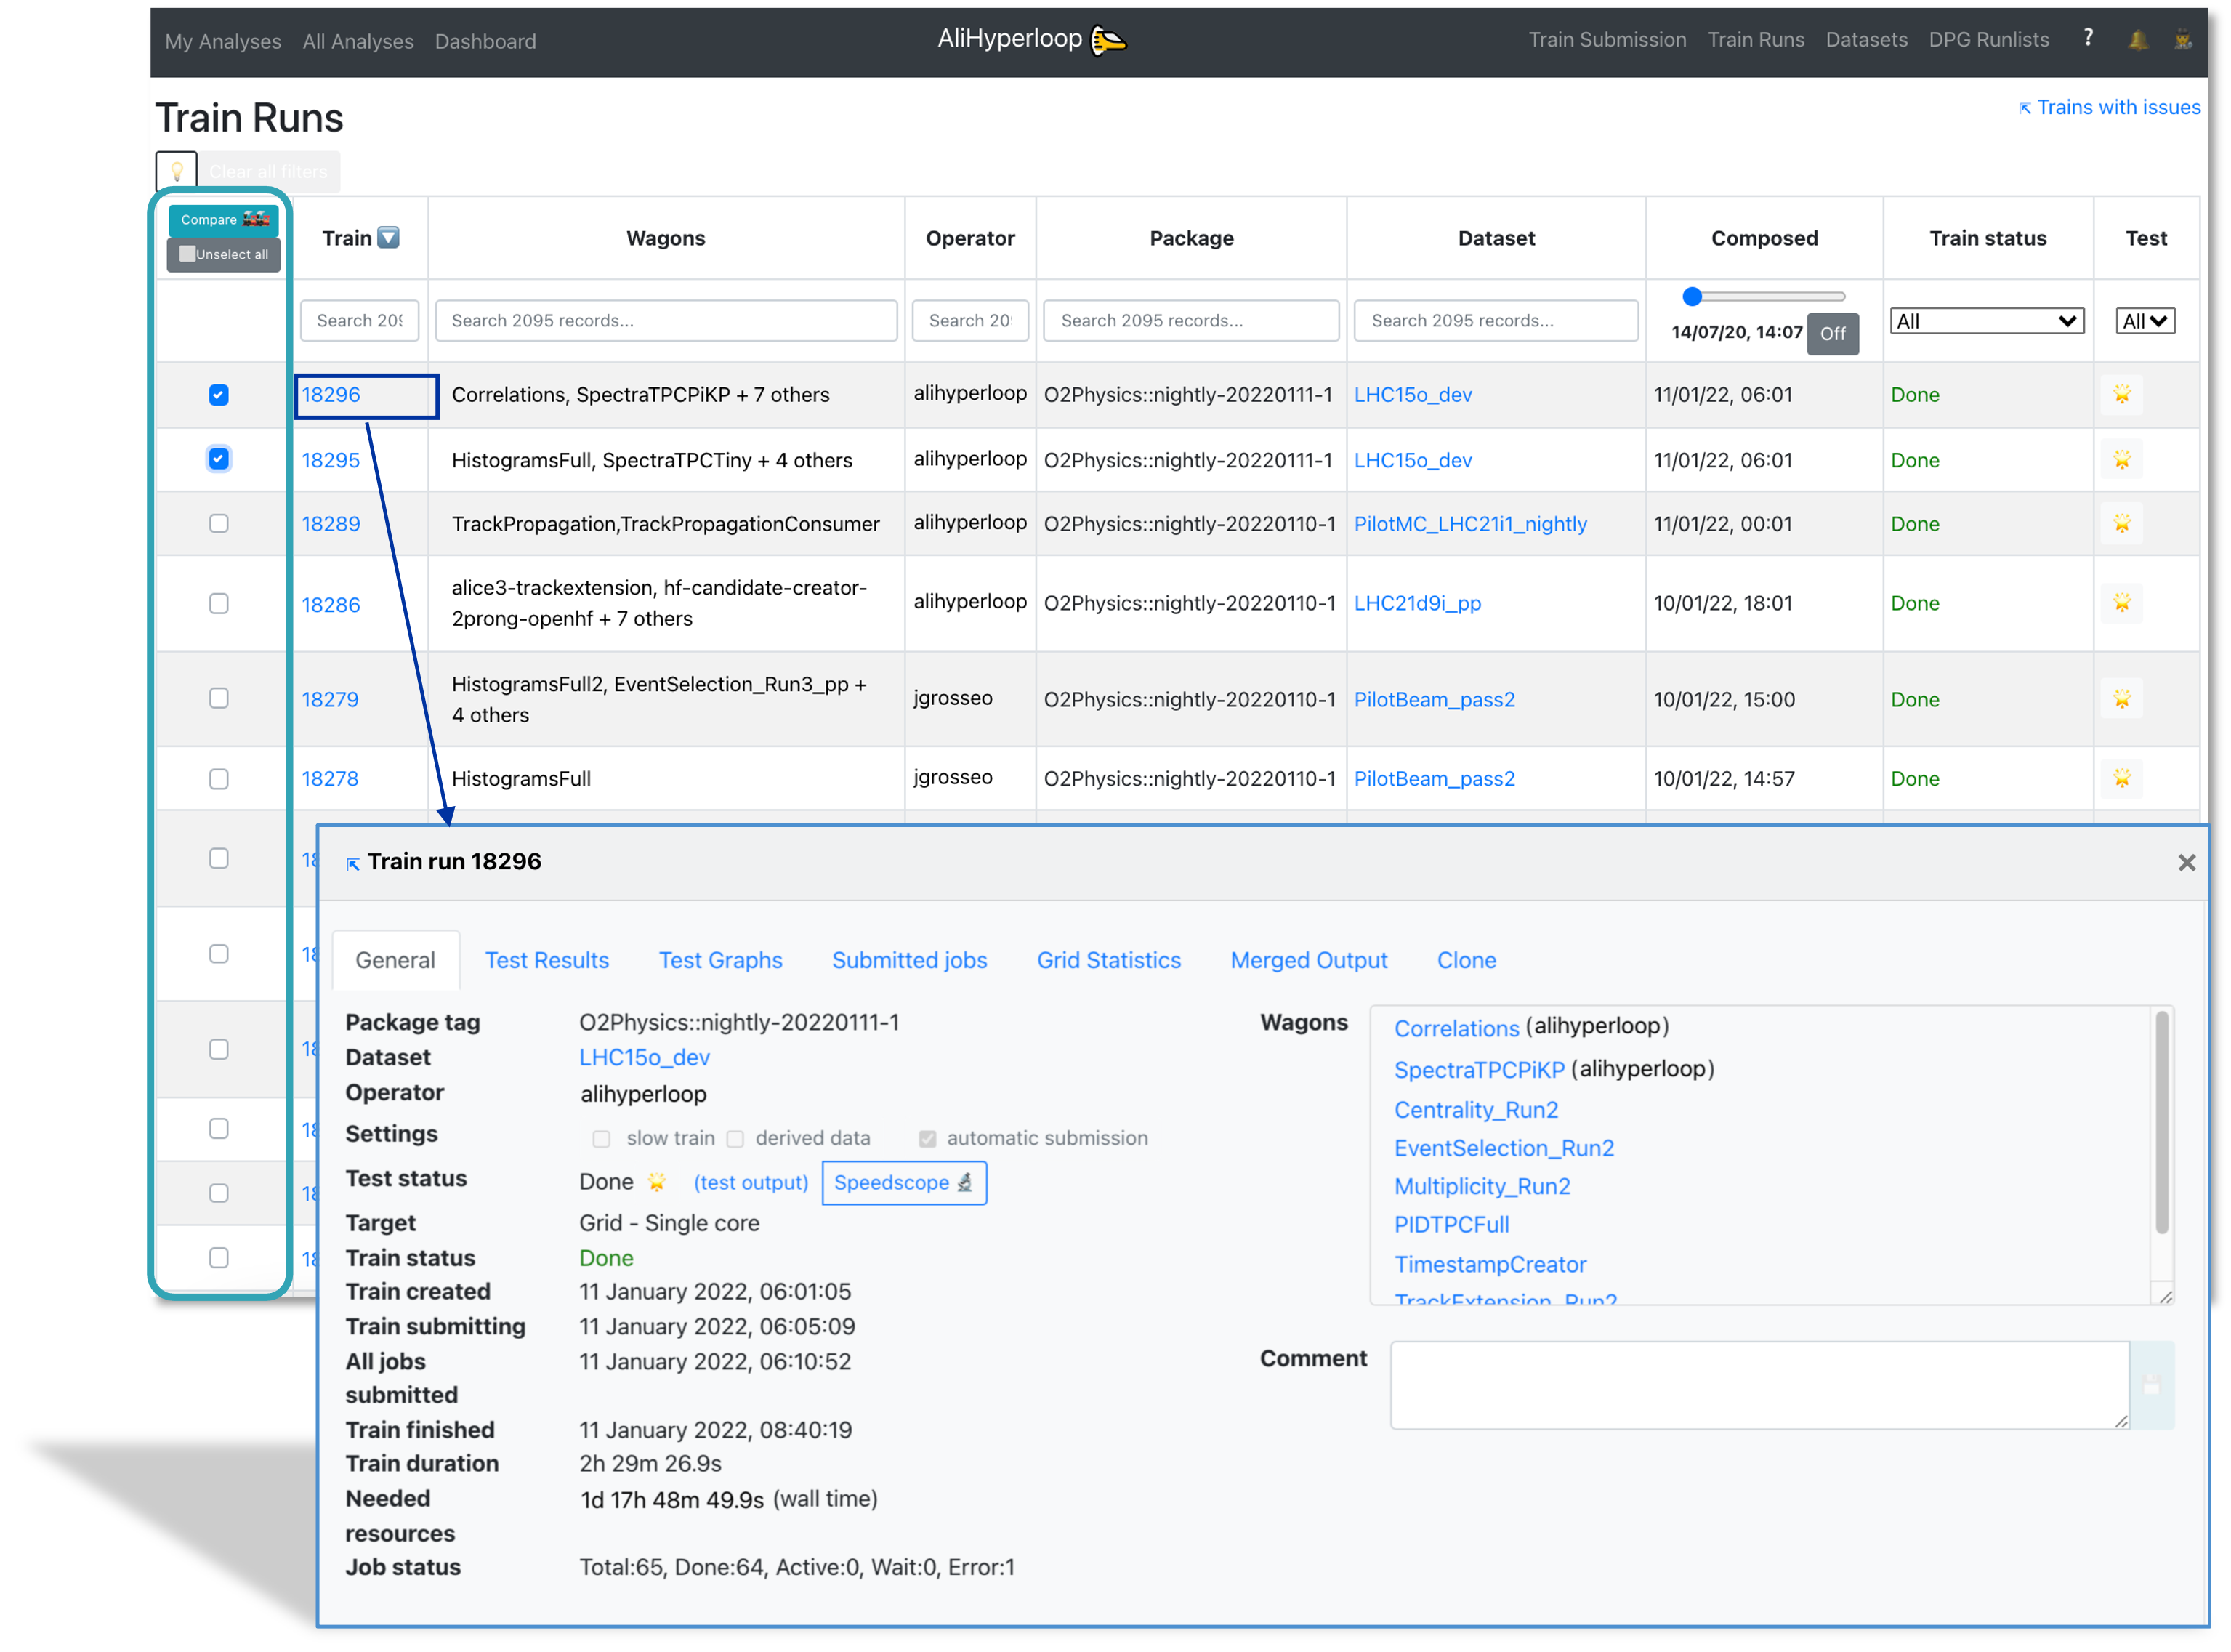
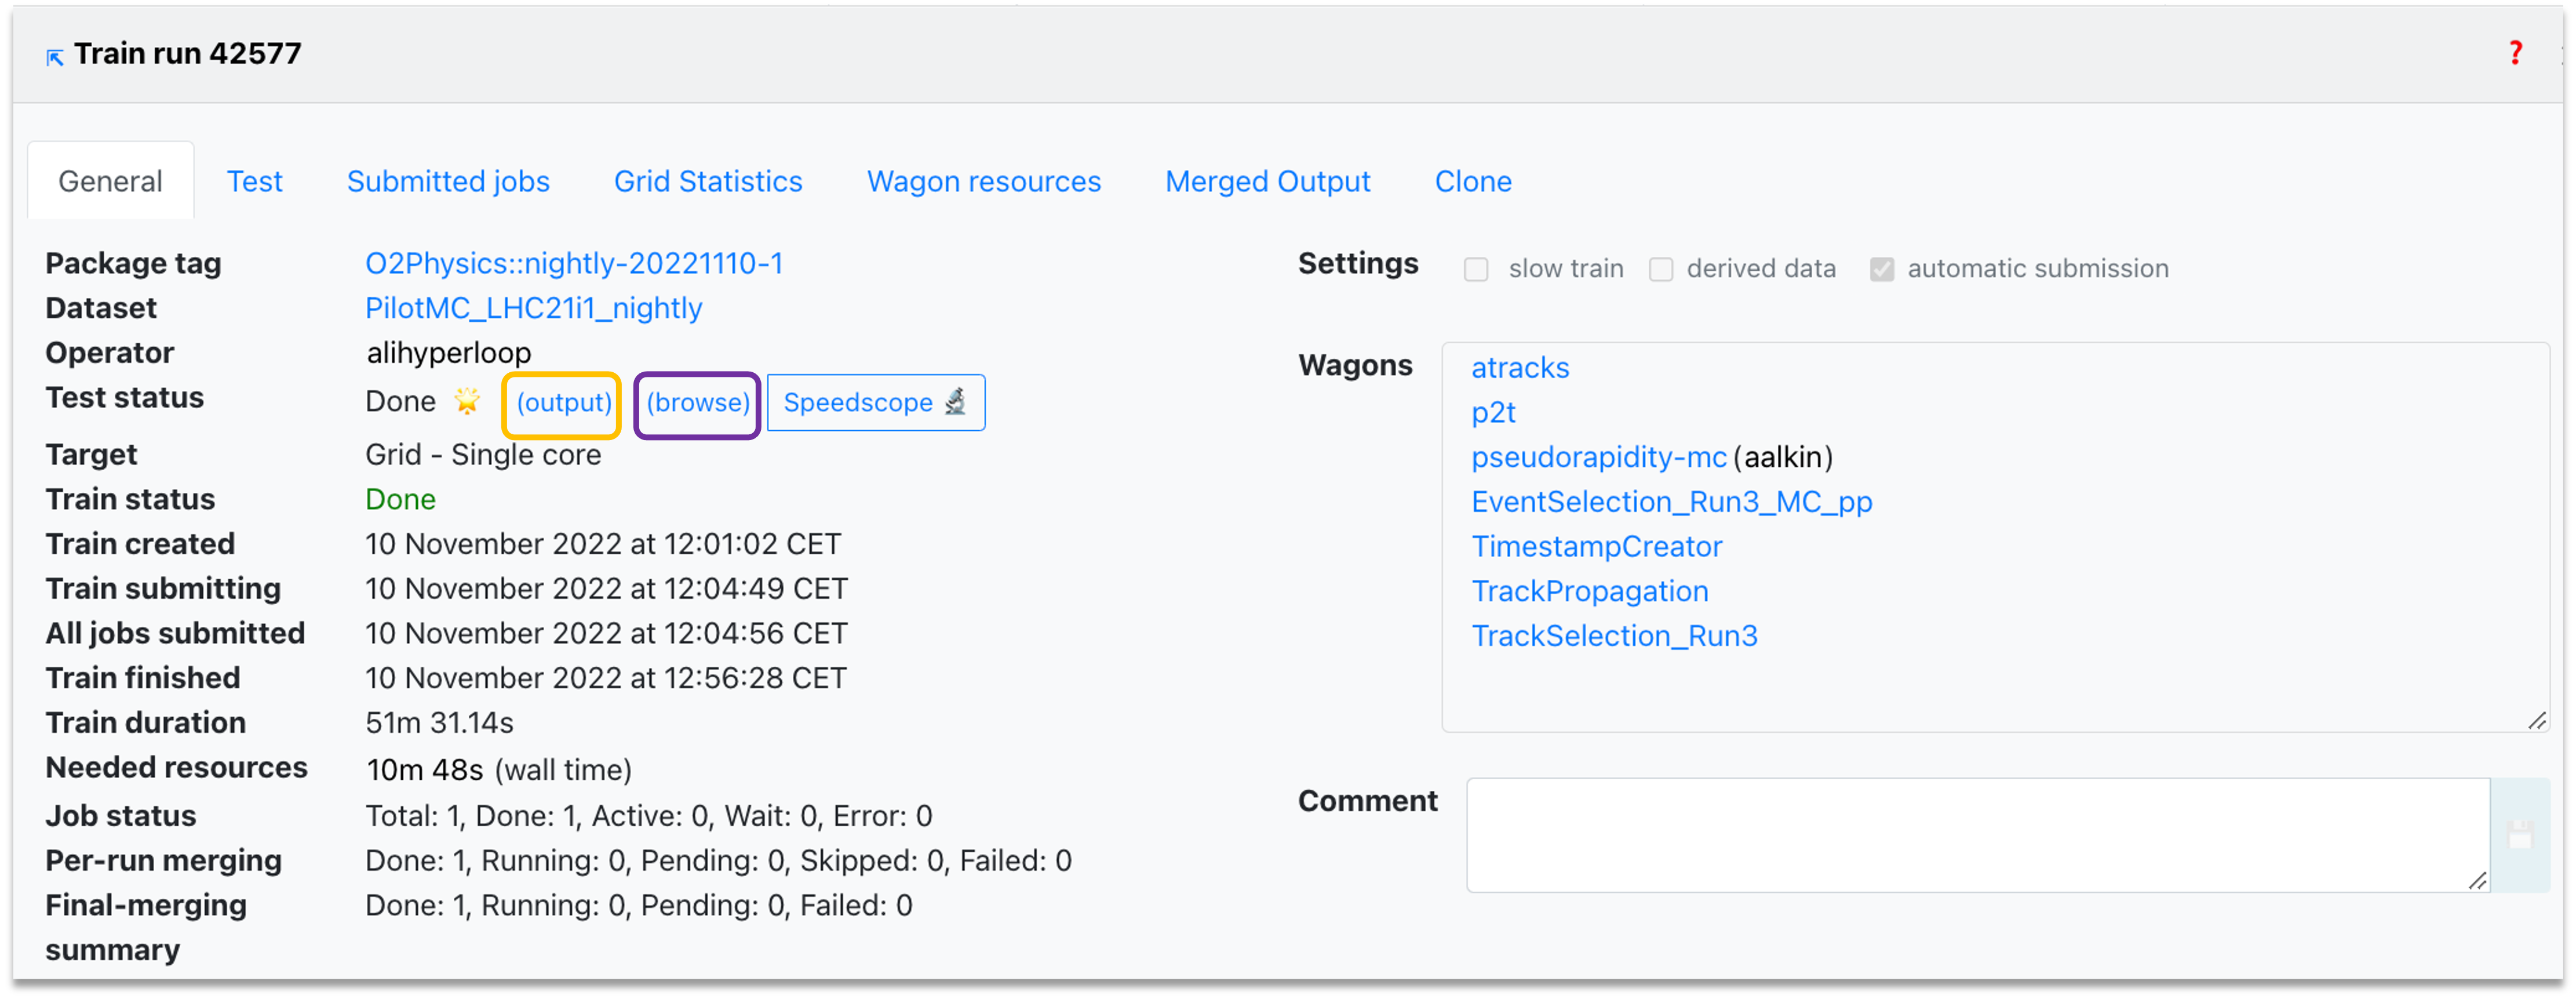
Train Run Result
- The General tab displays the summary of the train's progress, direct links to dataset and participating wagon configuration, as well as direct links to the test output and the speedscope profiling of the task.
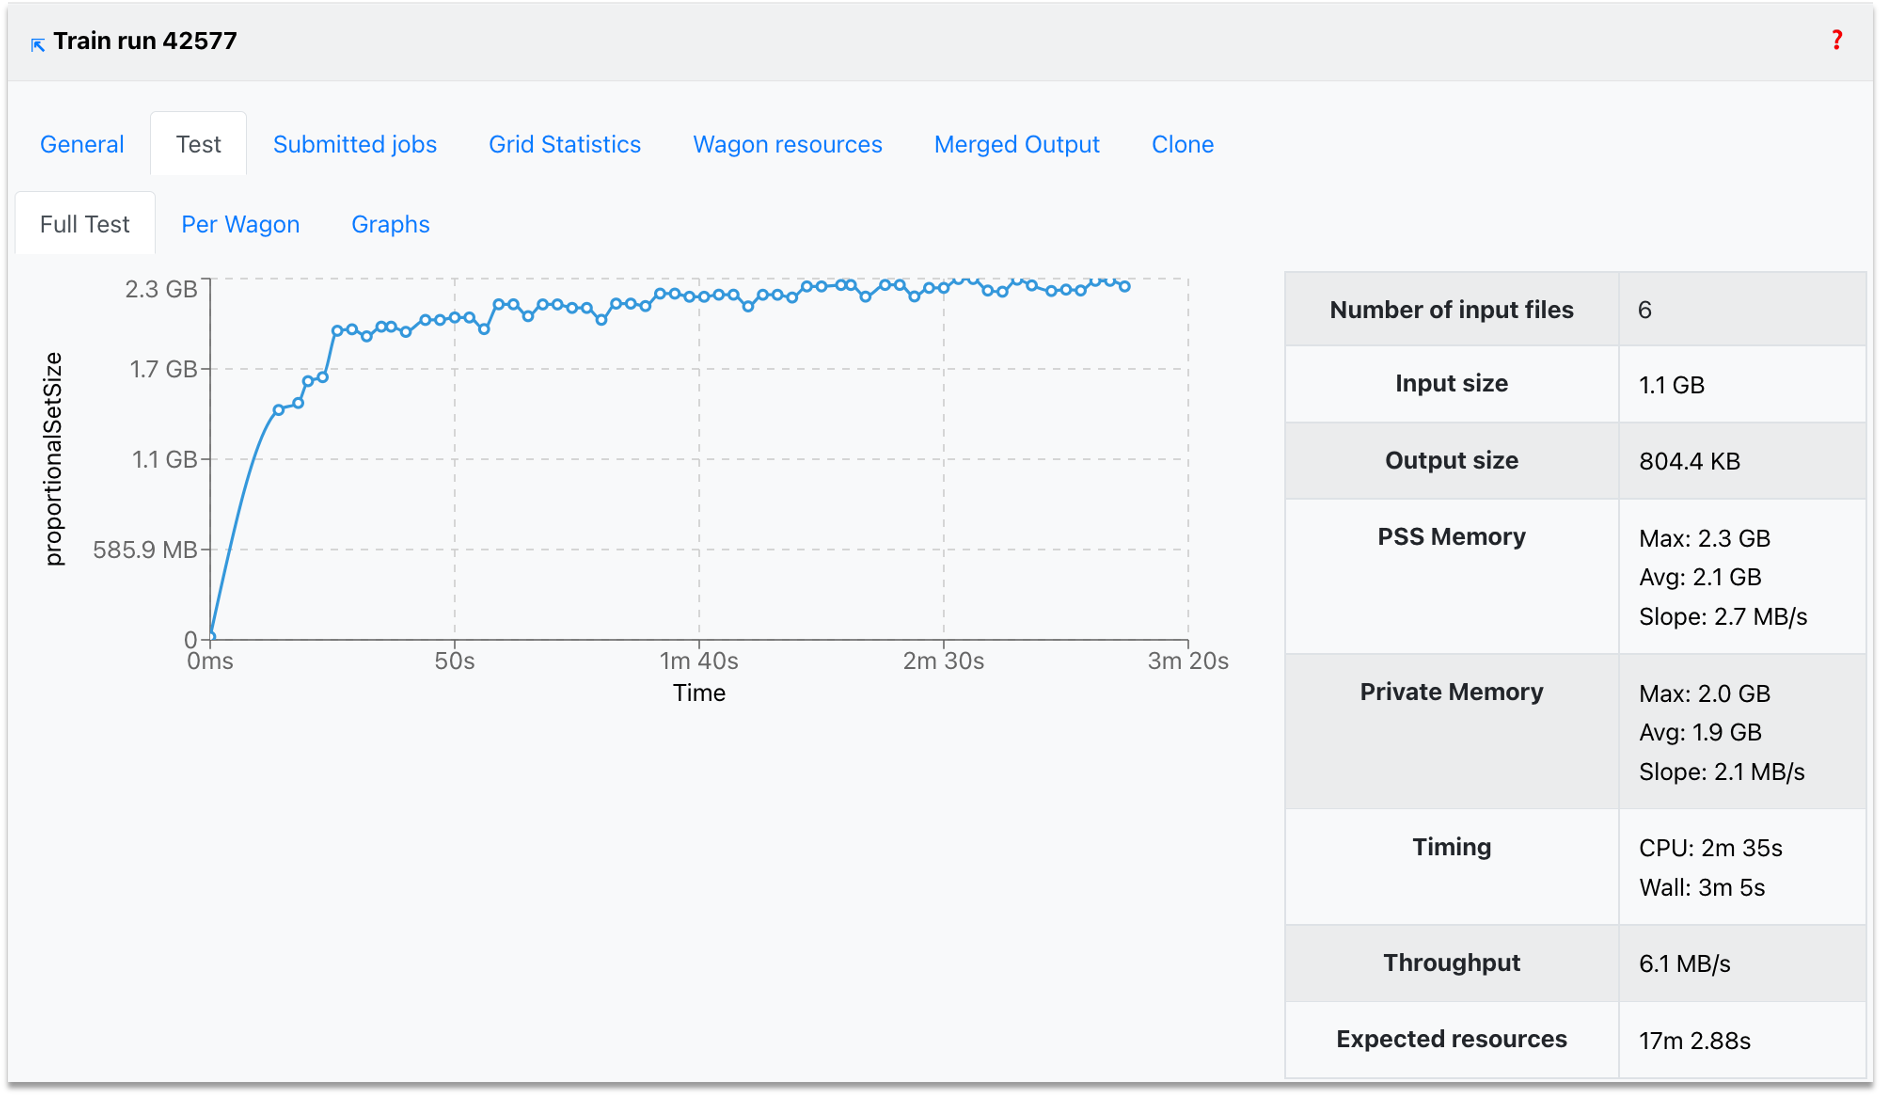
- The Test results tab shows the performance metrics per device (reader, workflows, writer), along with the expected resources. You can use the interactive graphs (per device) to zoom into the area of interest (click and drag) or zoom out (double-click).
-
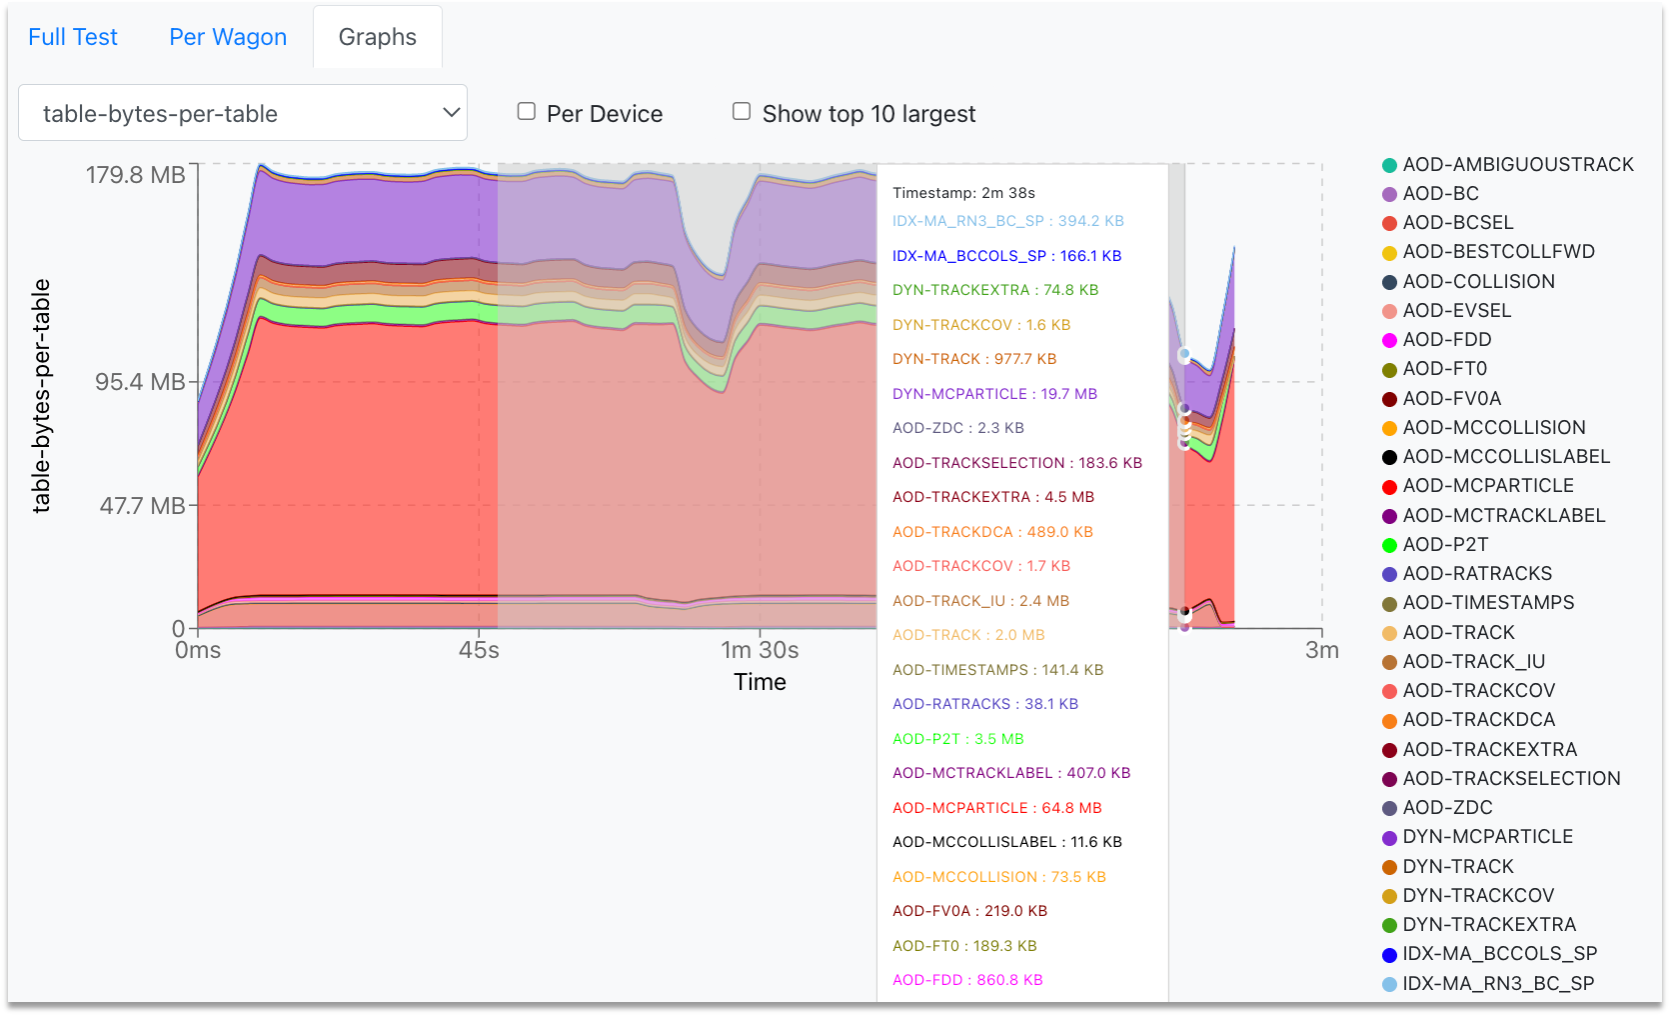
In the Test Graphs tab, the user can plot the available metrics for the specific Train run. By hovering over the graph, the corresponding values are displayed in a dynamic window, stating the value for each participating wagon.
- The metric can be selected from the upper-left dropdown, and the graph will change accordingly.
- The user can choose to plot the metric data per device, by checking the Per Device near the dropdown.
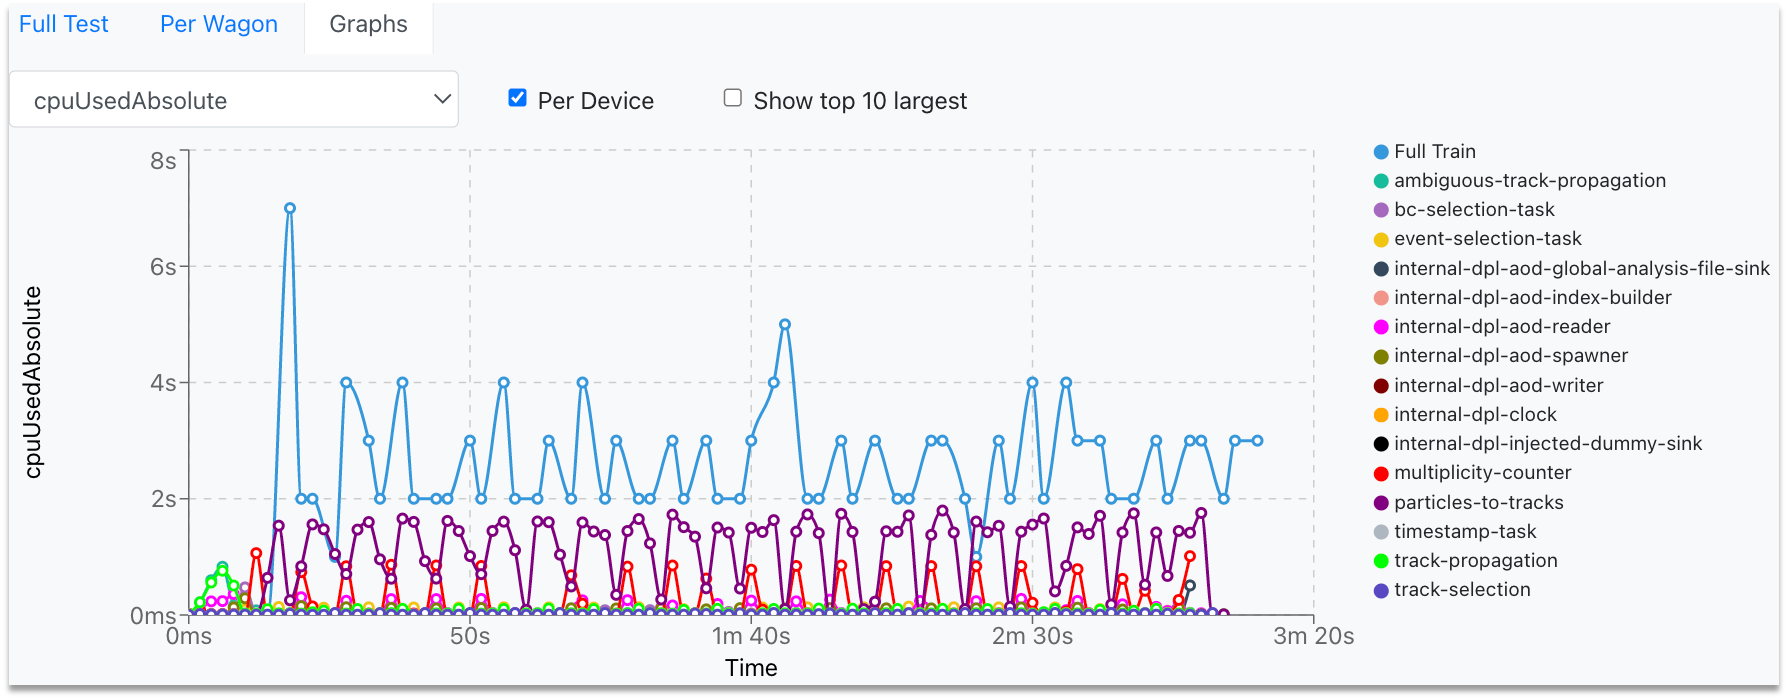
- In order to plot the highest ten graphs, that means the graphs with the highest average, the user can click the Show top 10 largest checkbox.
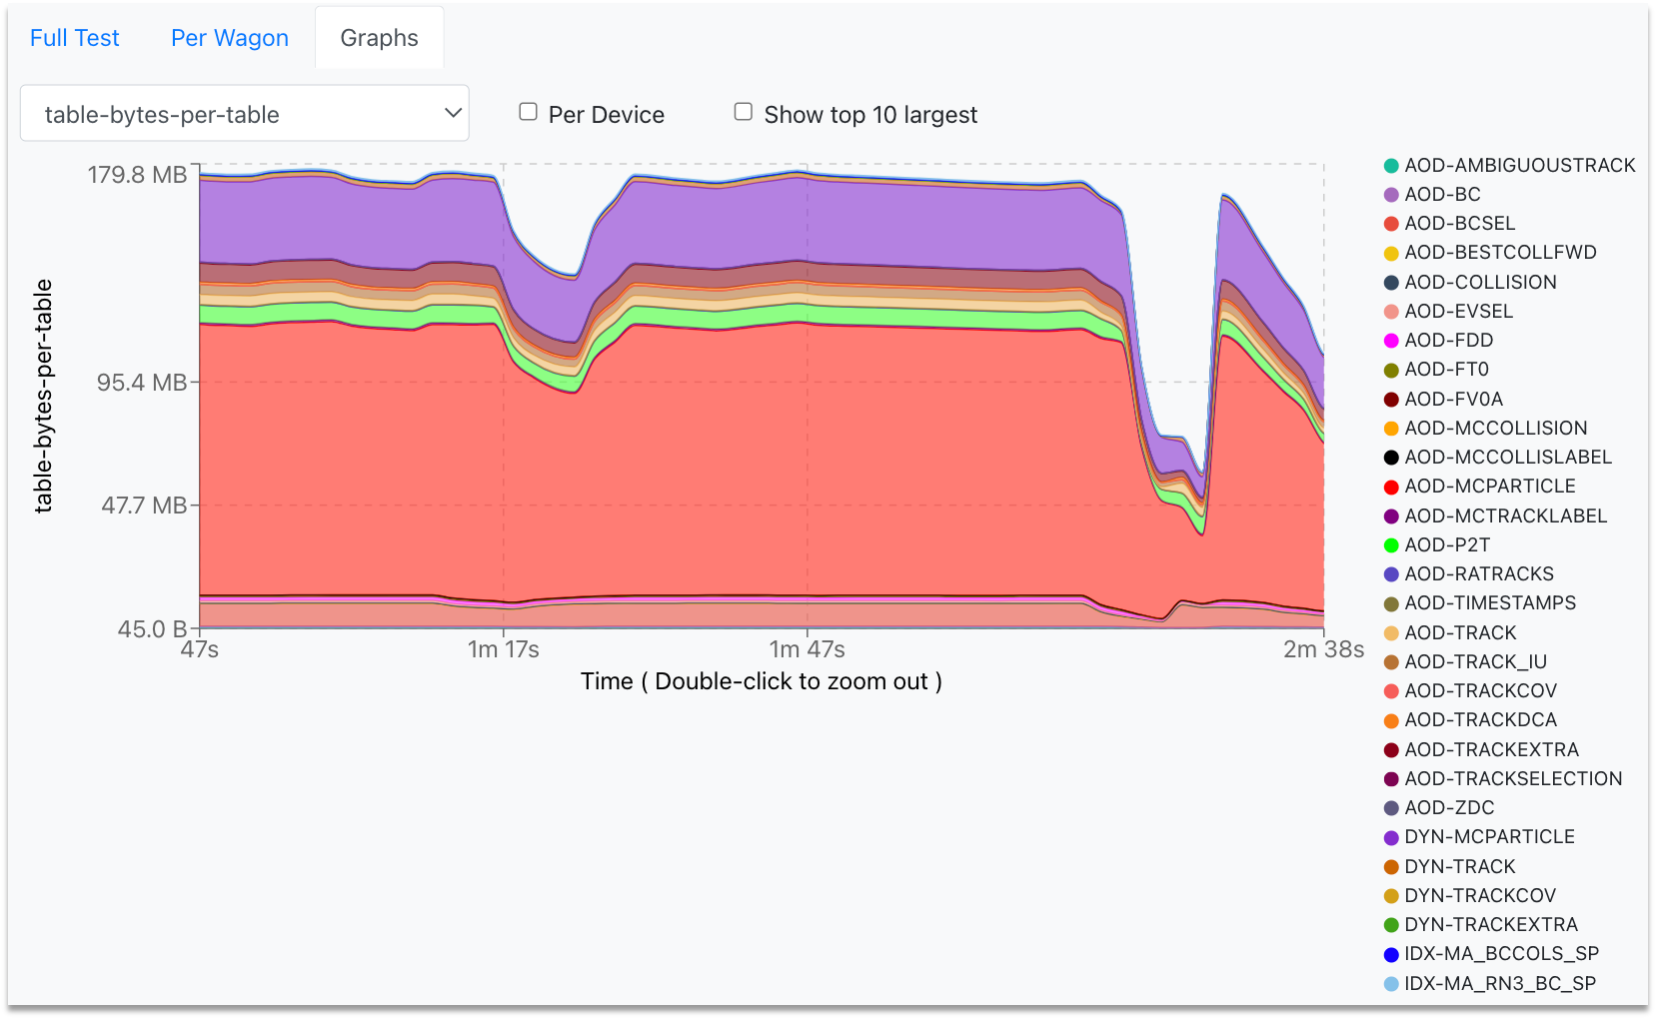
- The user can zoom into the graph by clicking and dragging the mouse along the area of interest. For zooming out, the user must double-click on the graph.
-
To produce this type of performance graphs for a local O2 execution, follow the instructions here.
-
In Submitted jobs, you can see the summary of the master jobs, along with links to the IO Statistics and Stack trace.
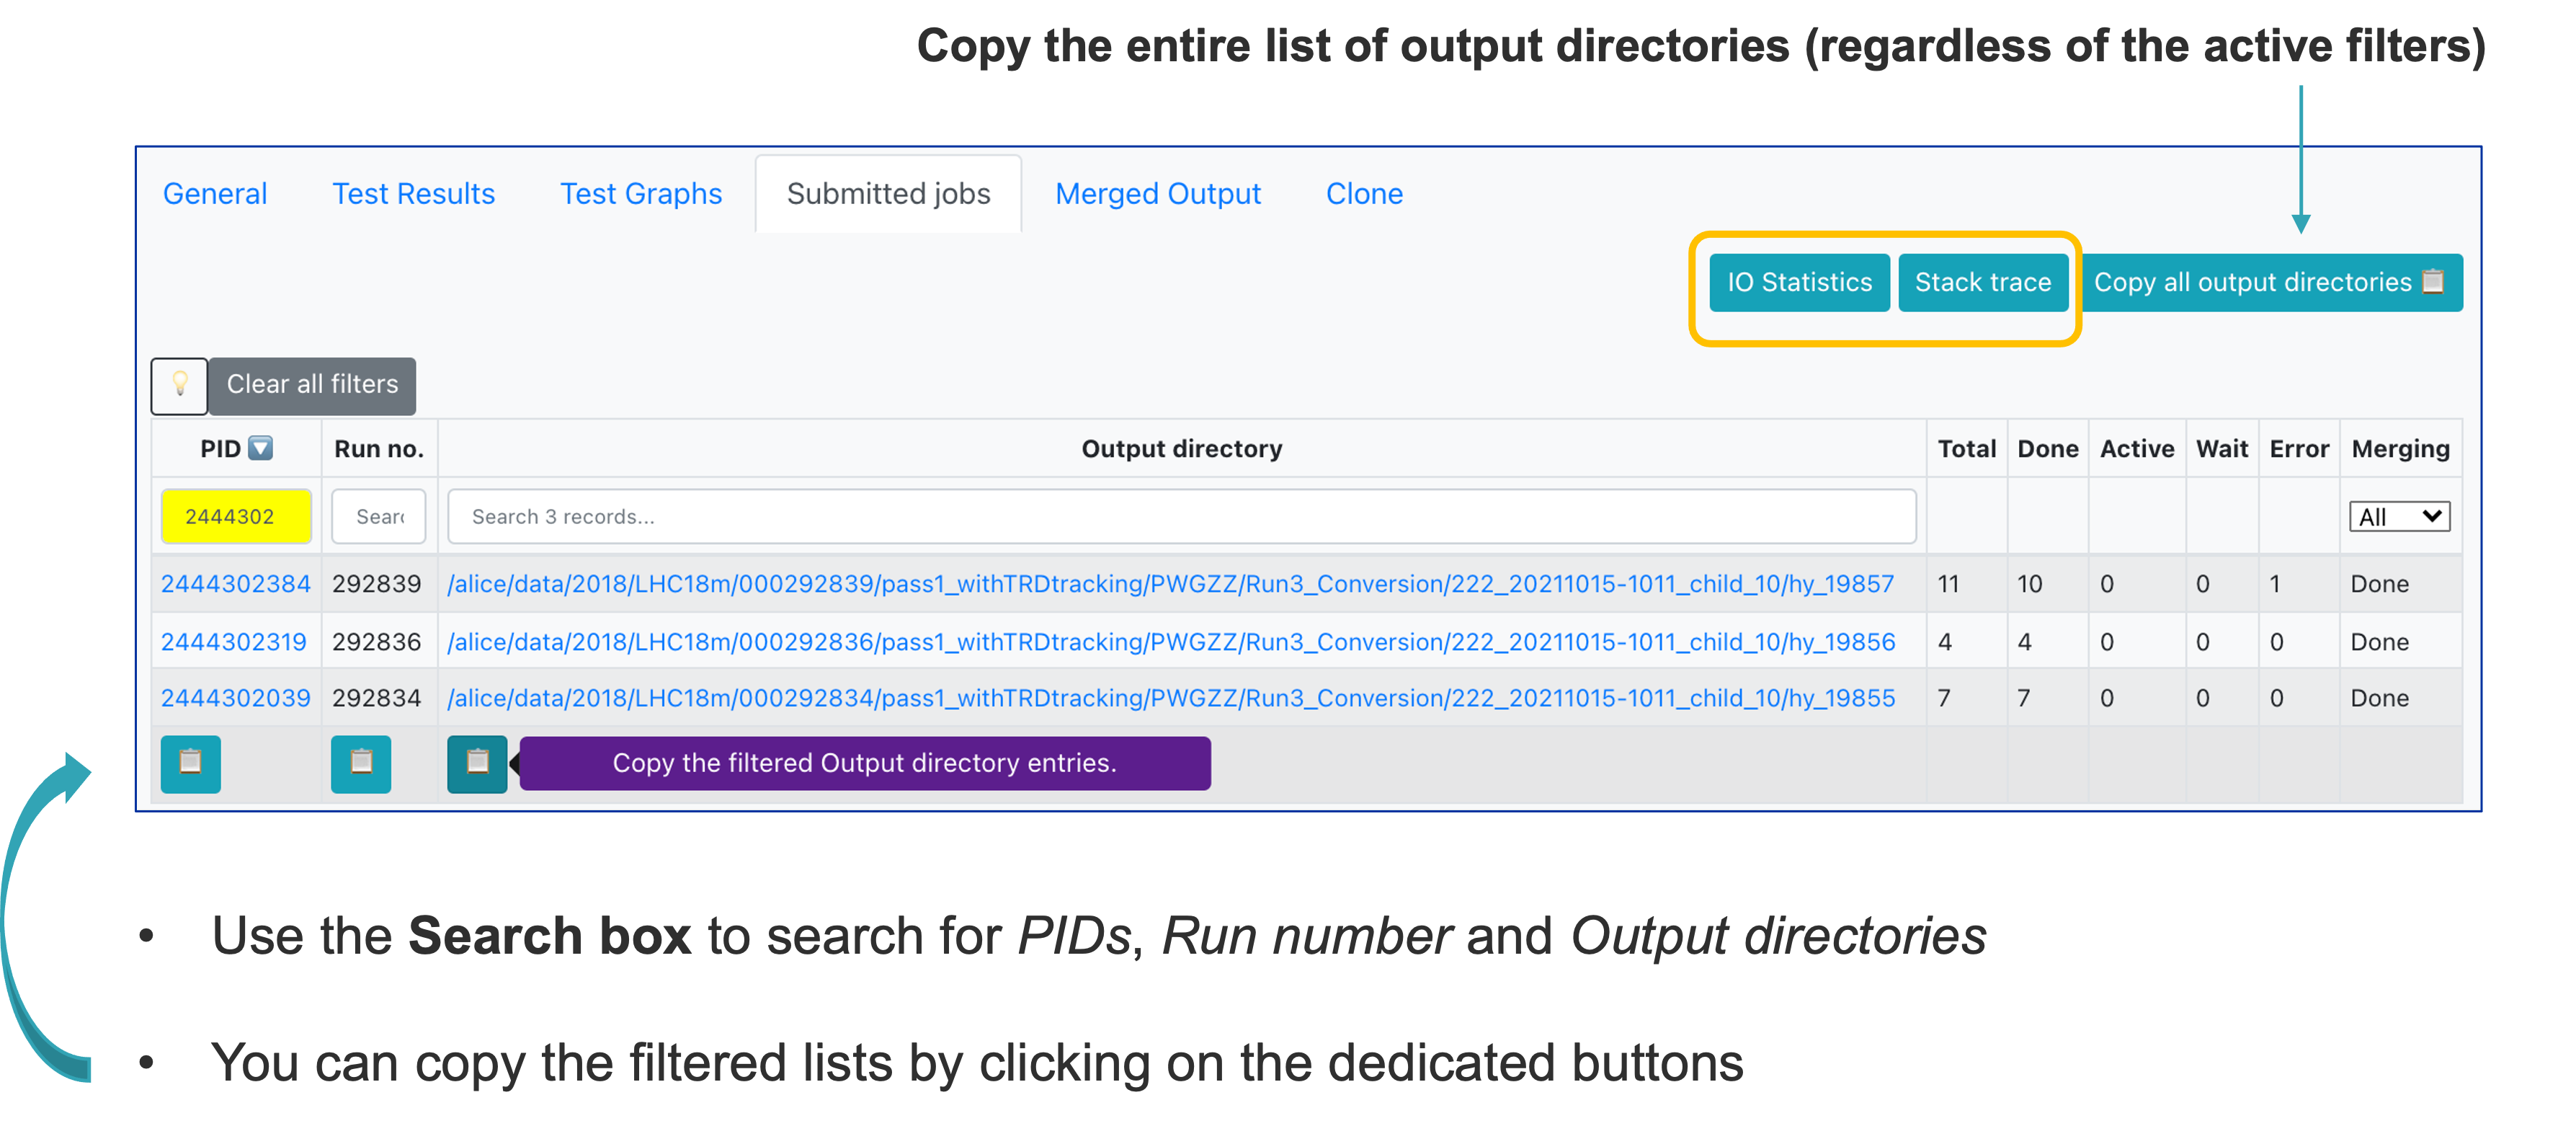
- Click the IO Statistics button to be redirected to the site activity information.
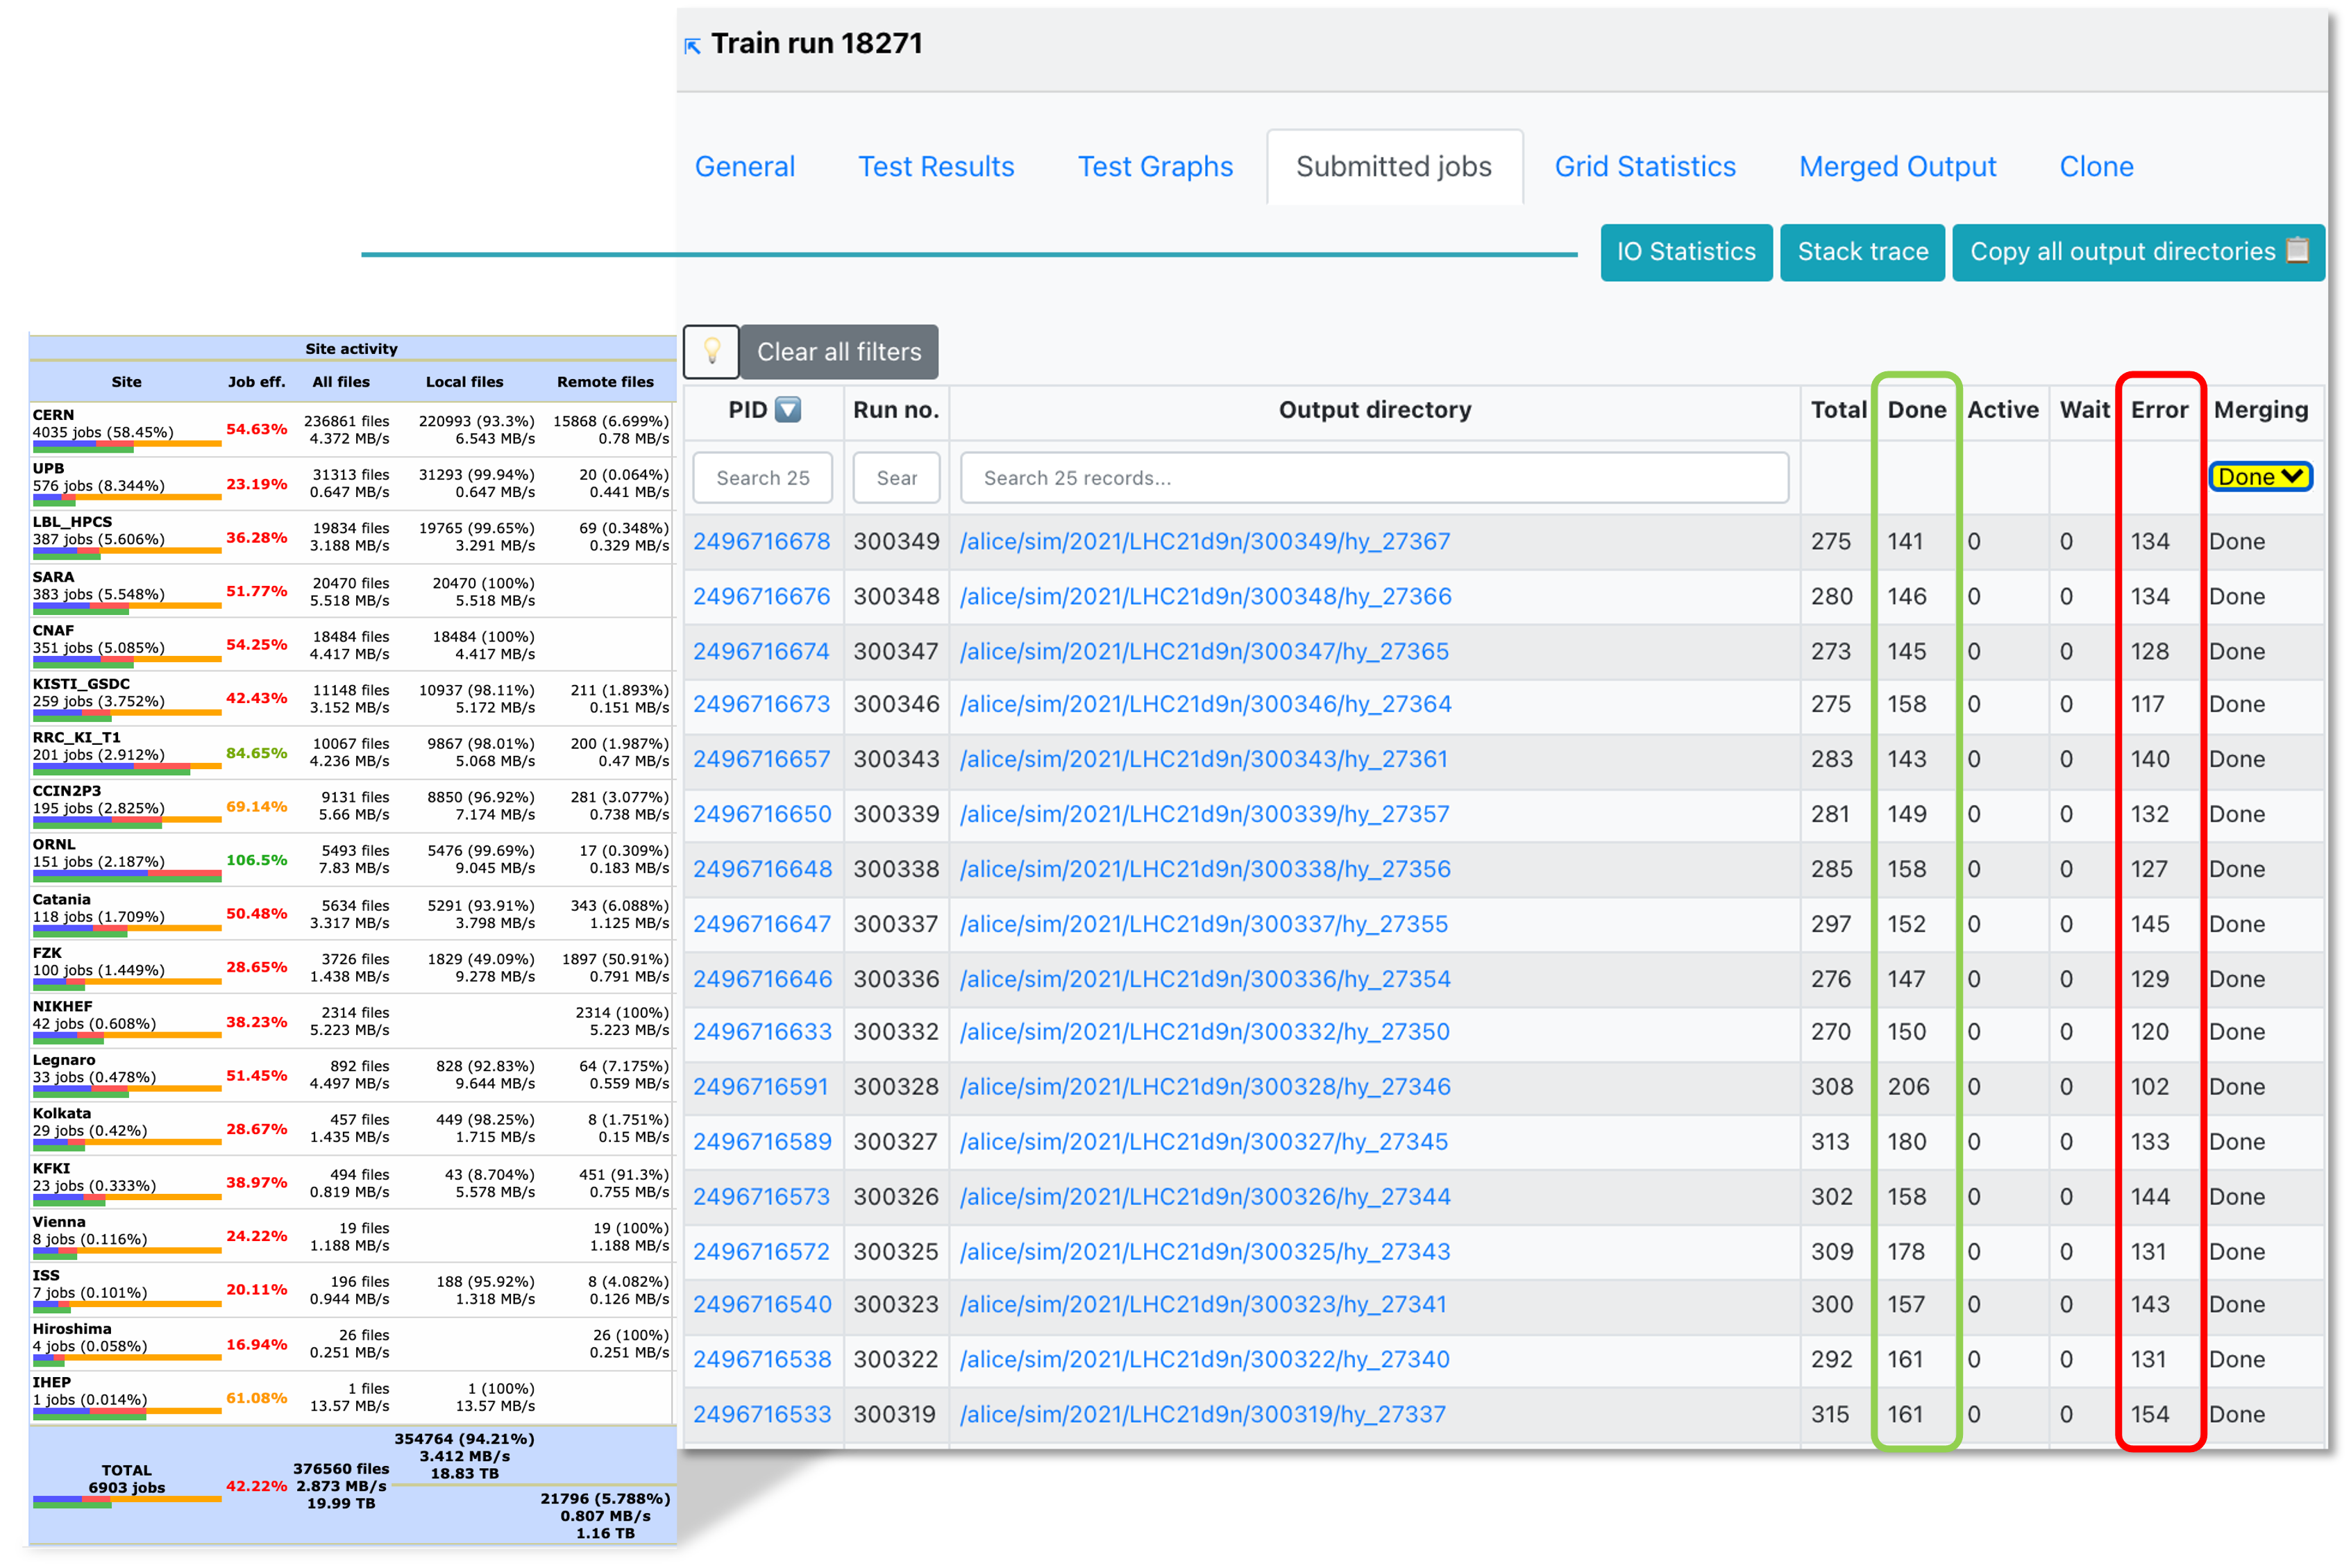
- Click the Stack trace button to be redirected to the stack trace information in MonALISA. Here you can see a summary of failures of your jobs.
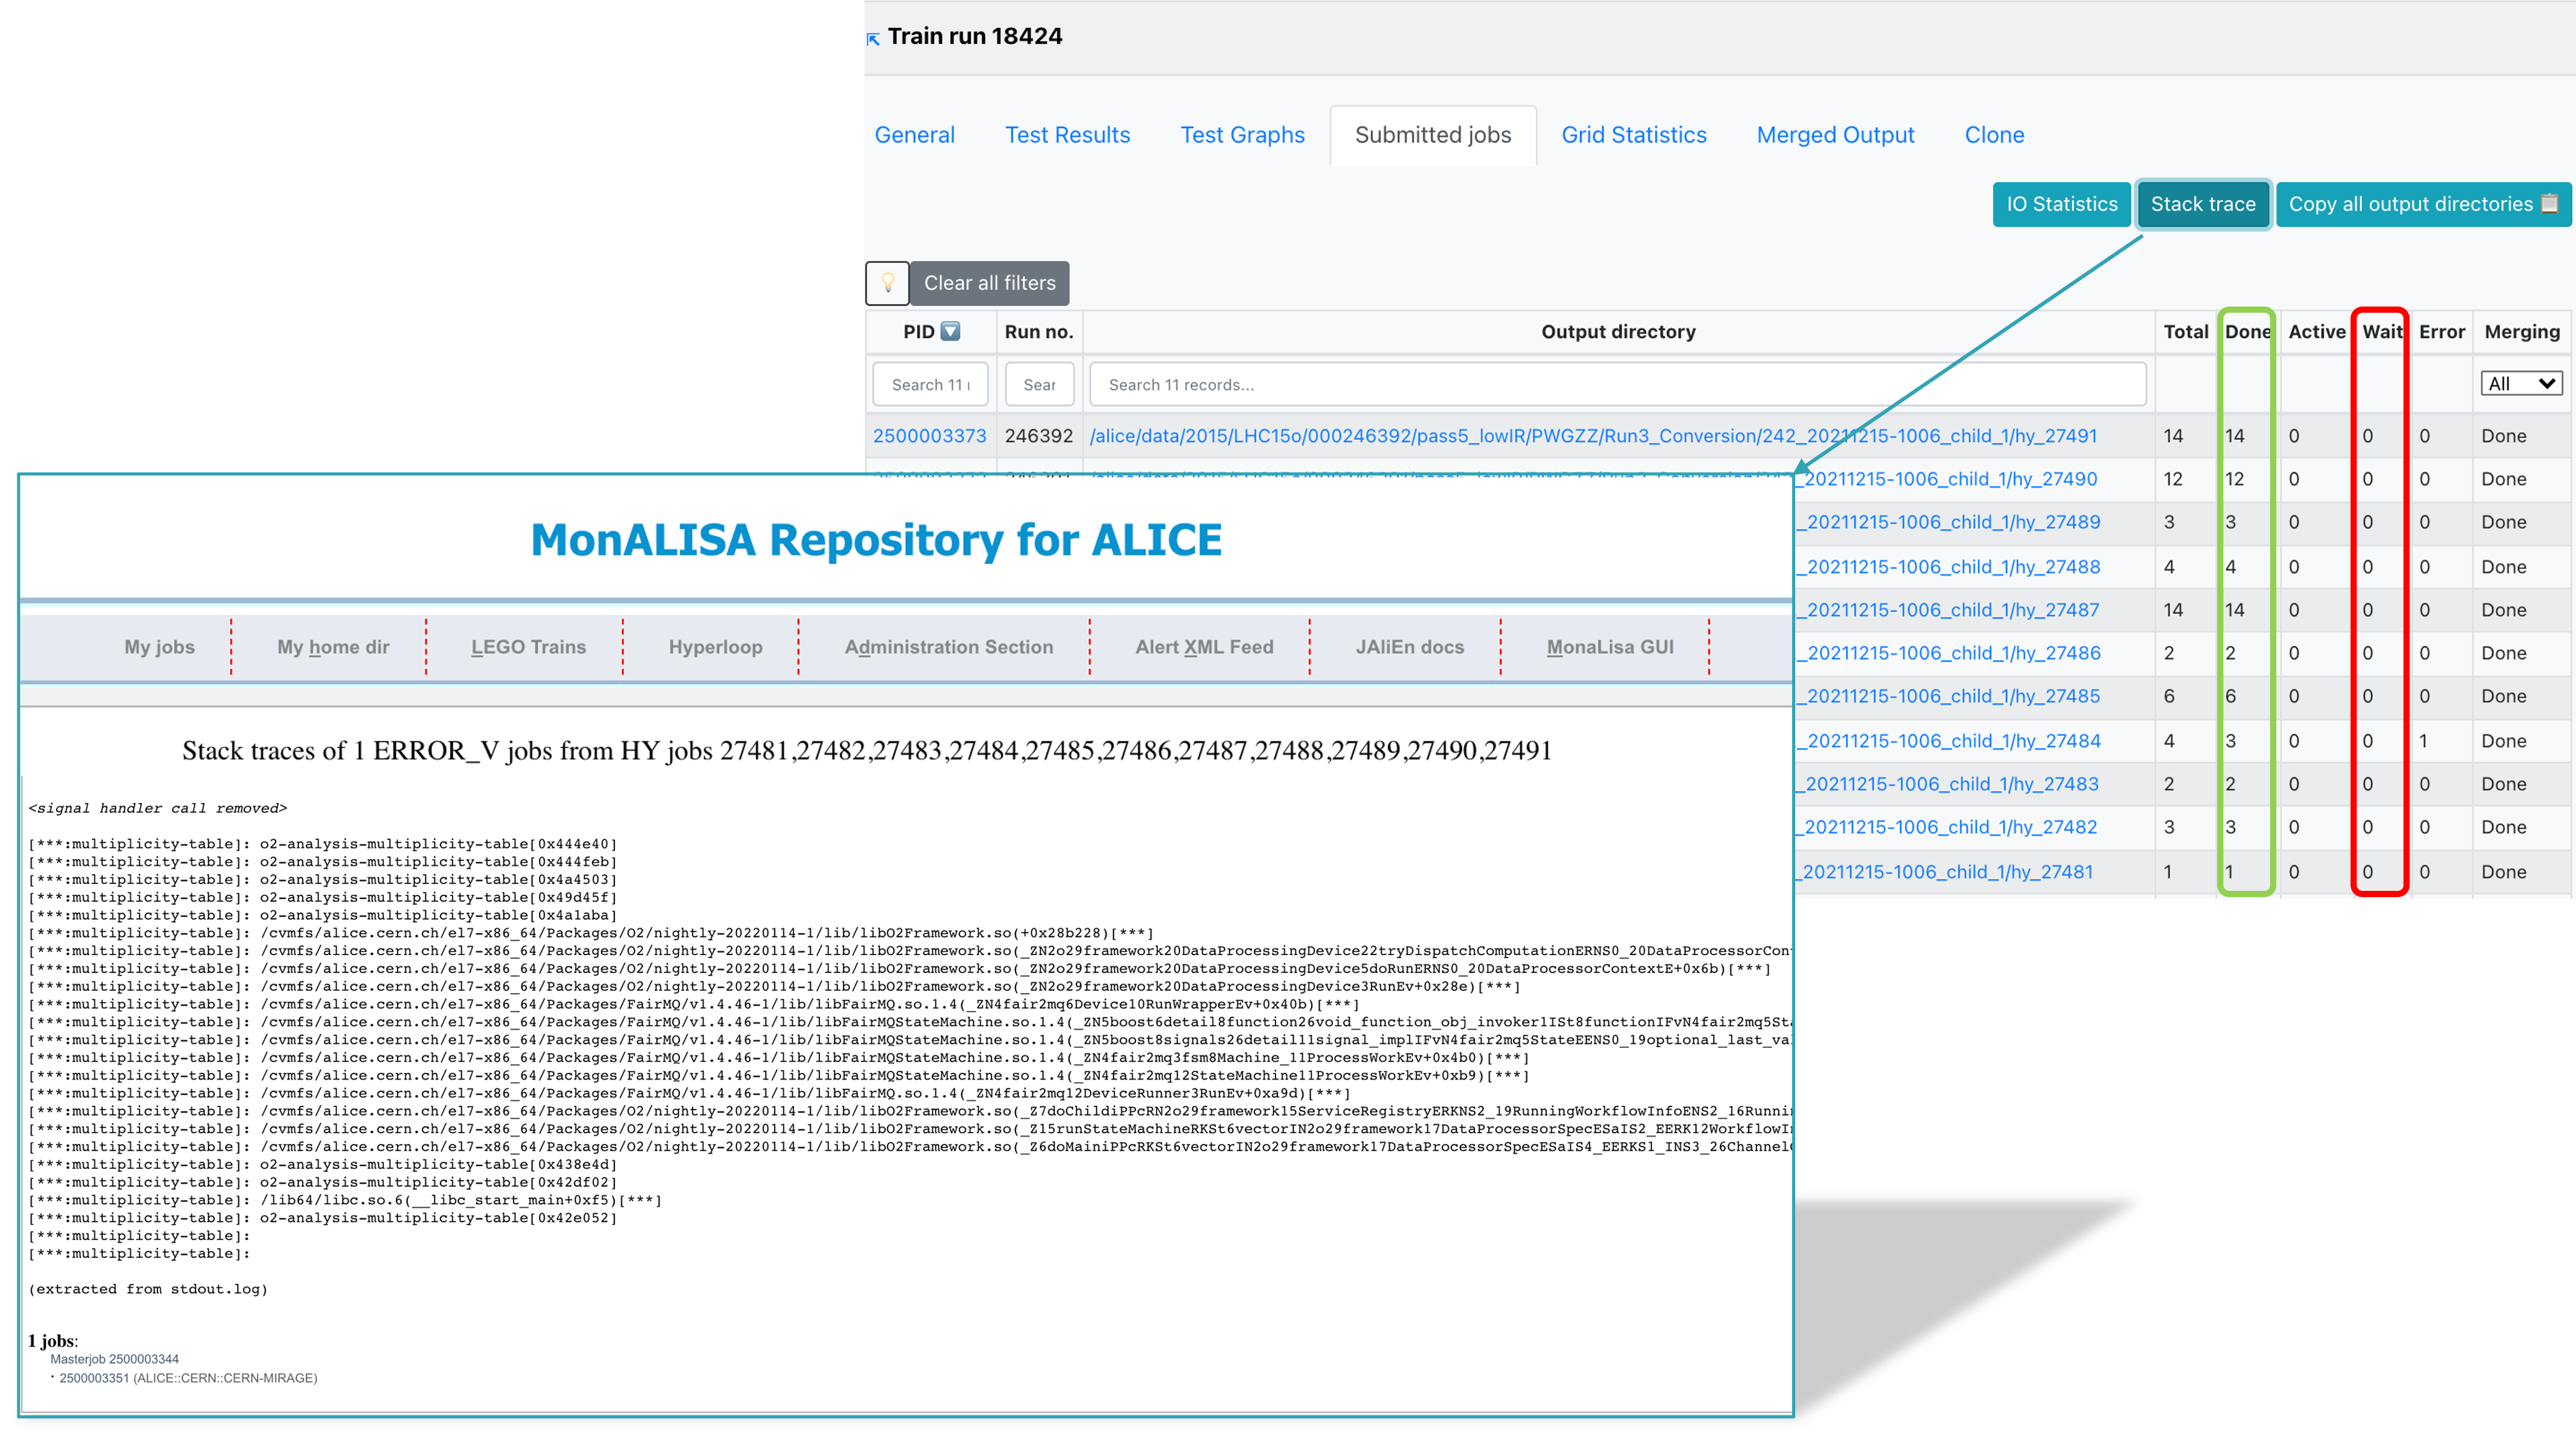
-
This information is collected when the masterjobs have finished from all ERROR_V jobs. Some information is already available while the train is running but make sure to check again when the train is in a final state. Common errors are grouped and counted. This allows you to investigate failures and debug them using the provided stack trace.
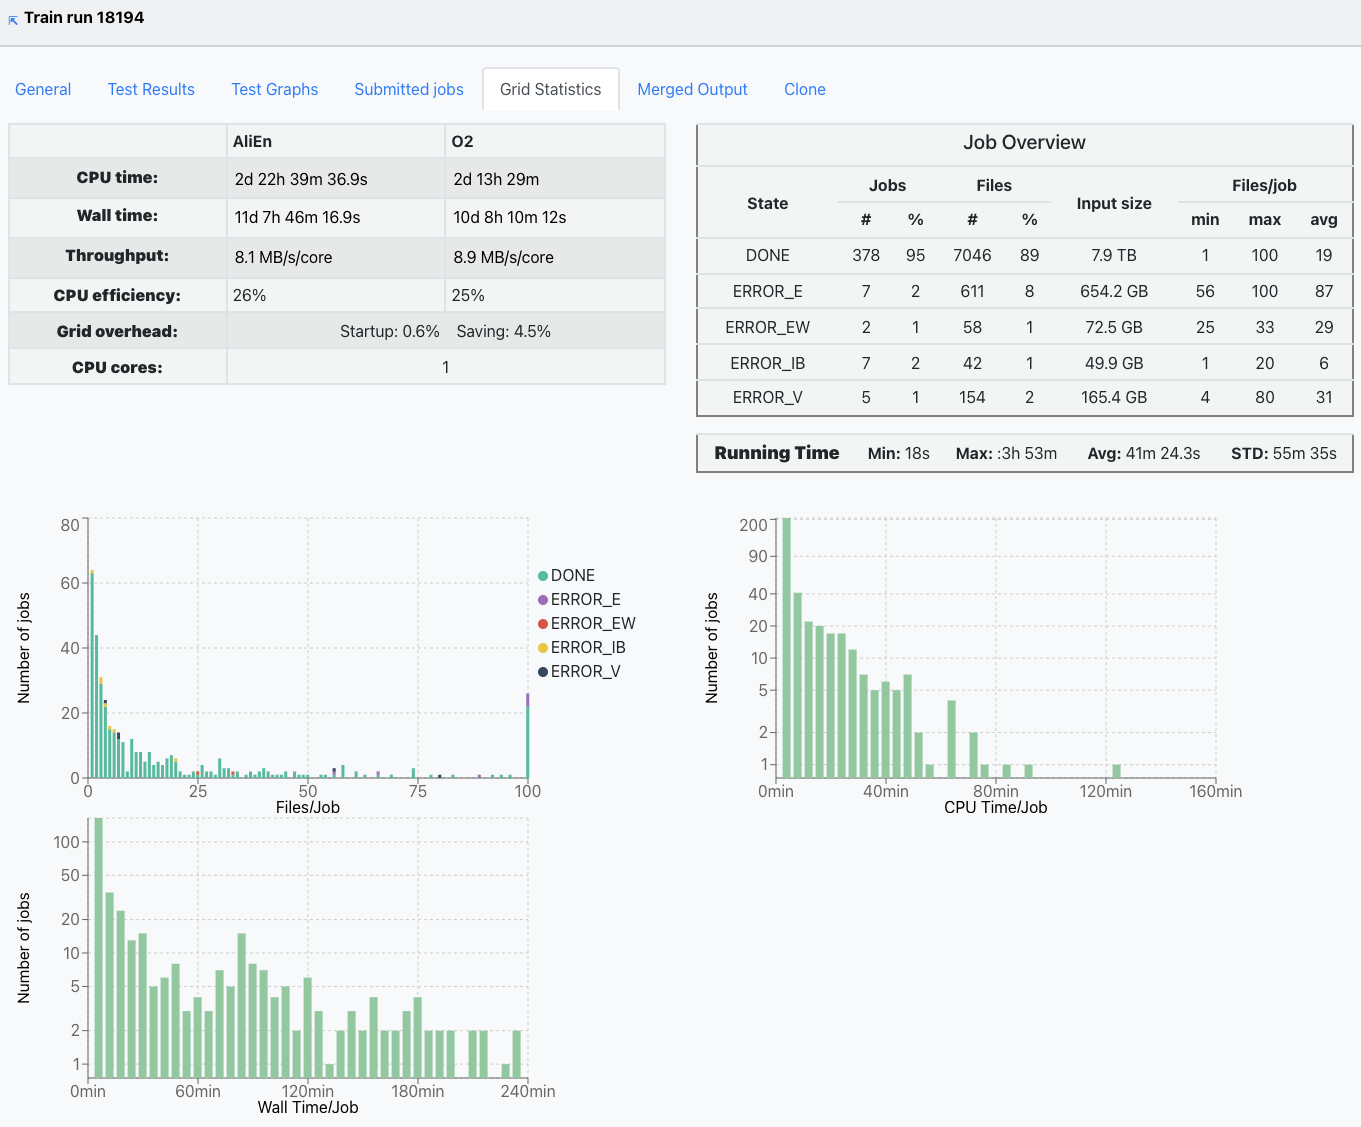
-
The Grid statistics tab presents a summary of the jobs performance and plots the Files/Job, CPU time/Job and Wall time/Job statitics.
- If the train is run as a derived data production and there are activated tables, the Derived data tab will be showed. This displays the tables which are produced by the task and saved to the output.
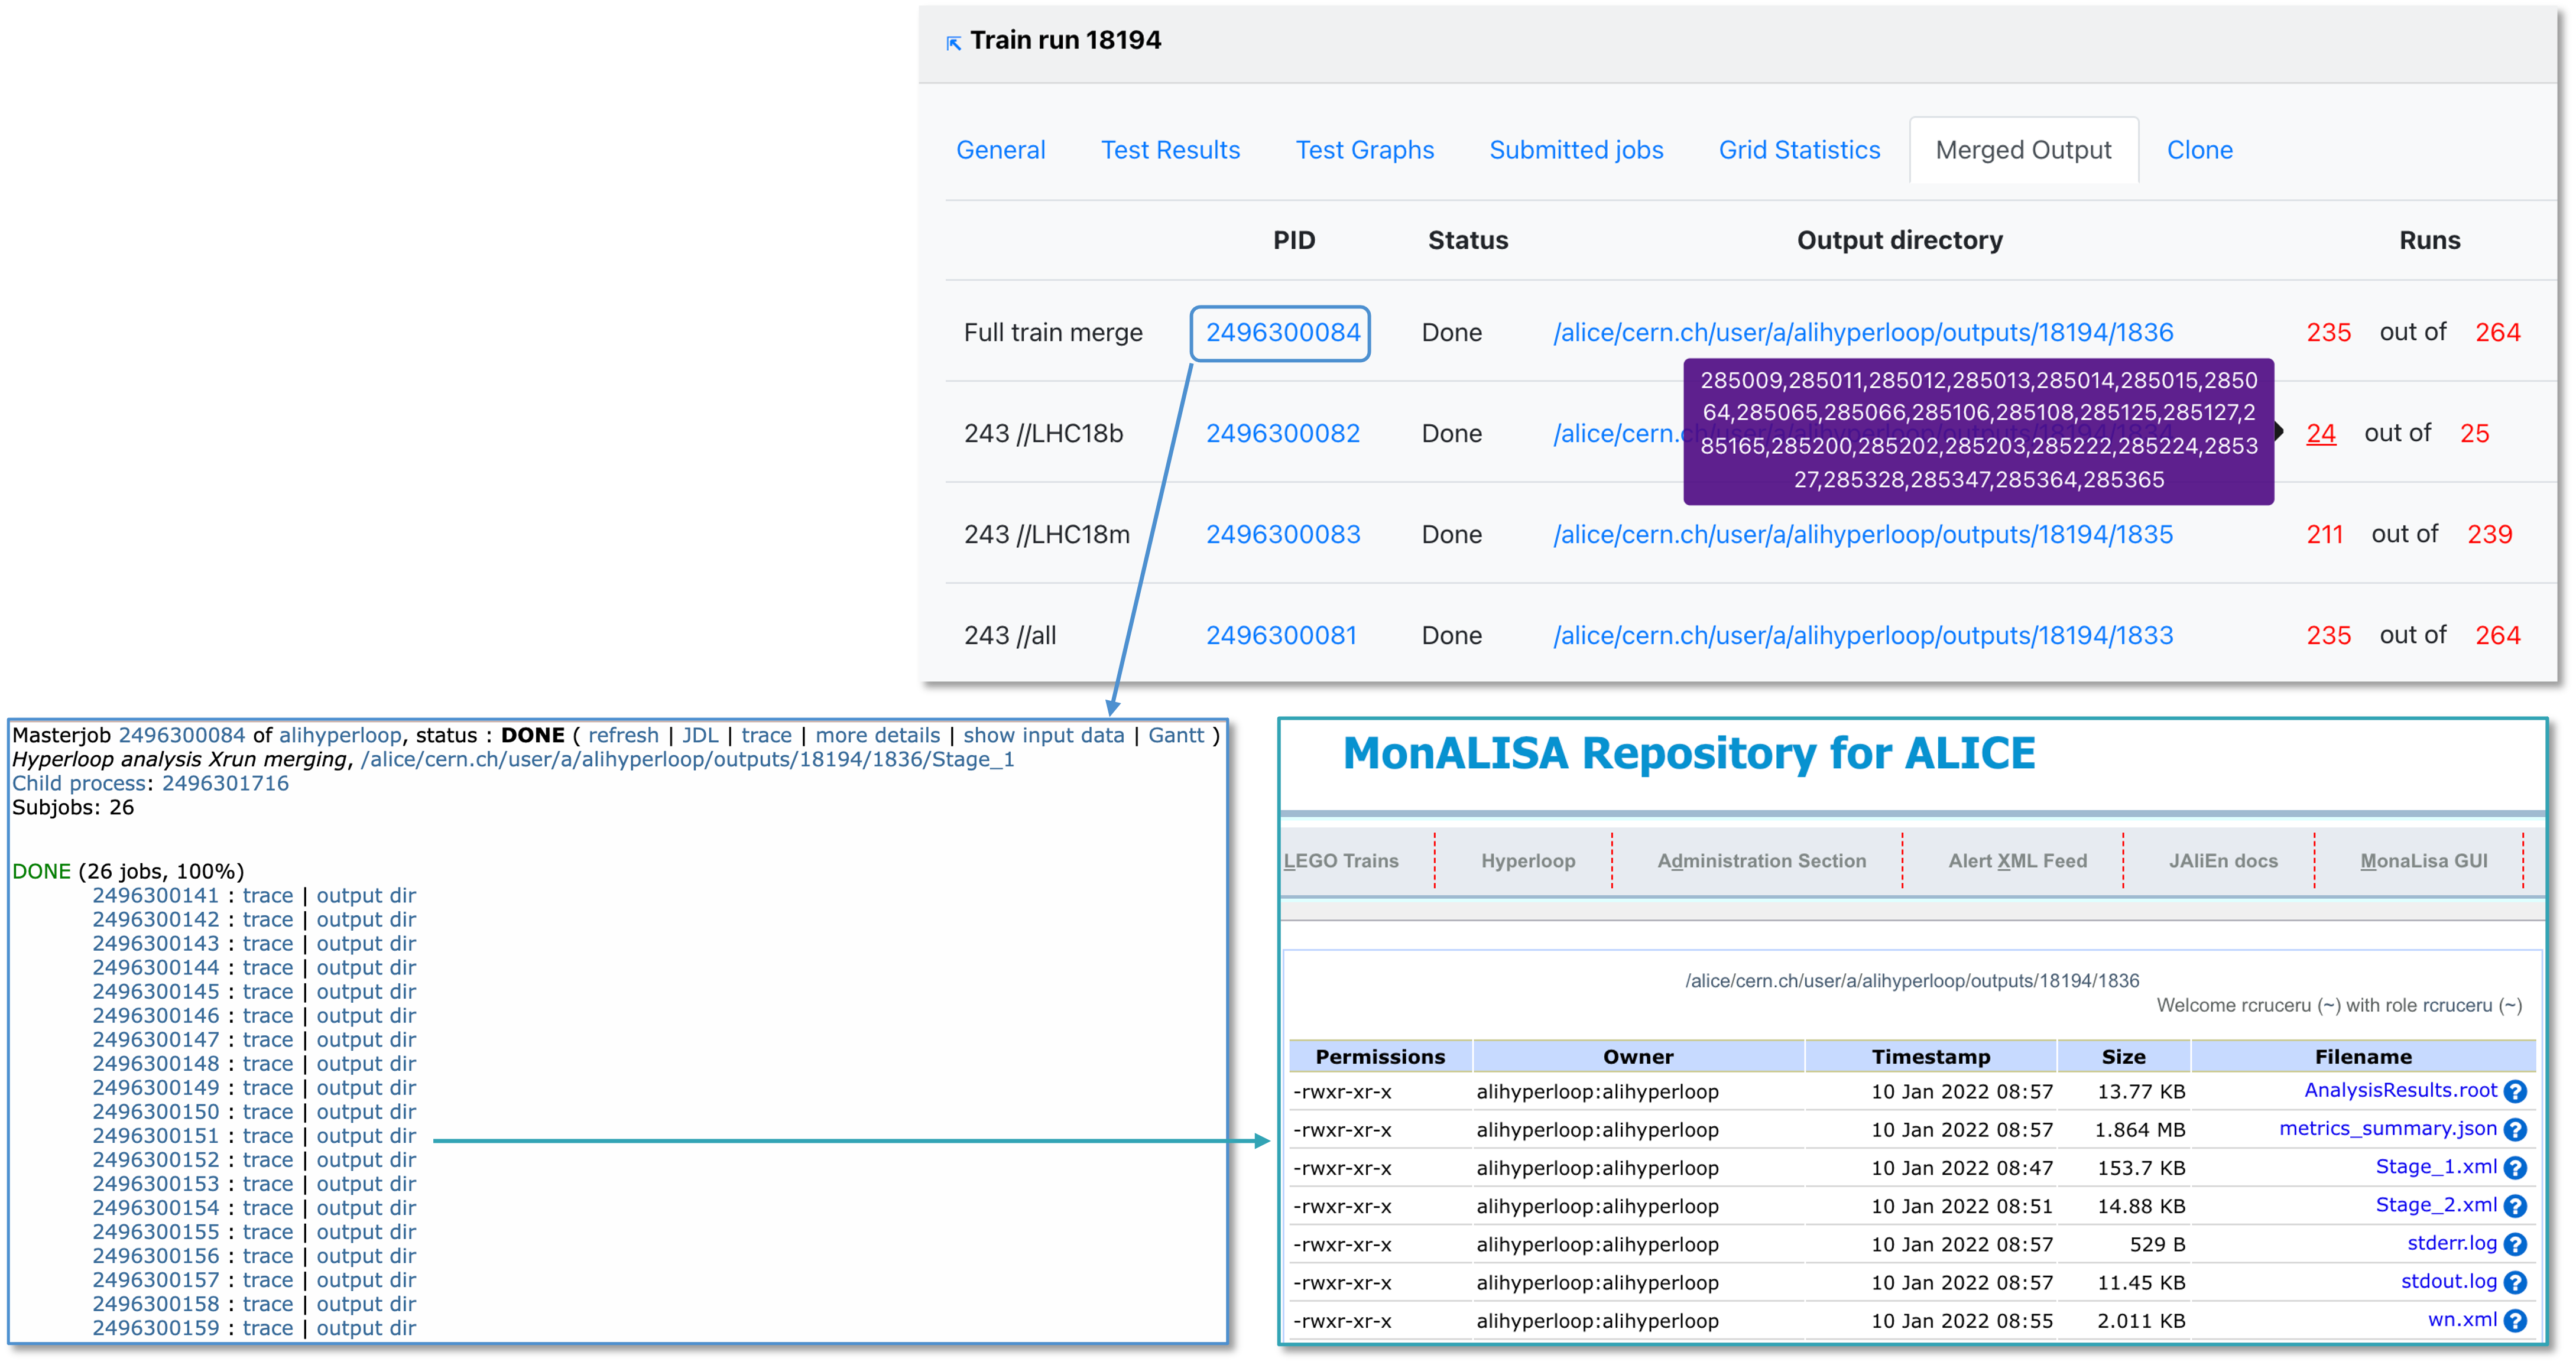
- Merged output displays the merging jobs and the output directories. A merged output is created for every mergelist and final mergelist in the dataset, along with the full train merge. The mergelists and final mergelists are defined in the dataset settings. Mergelists contain lists of runs from a single runlist, while final mergelists are used to combine mergelists across productions.
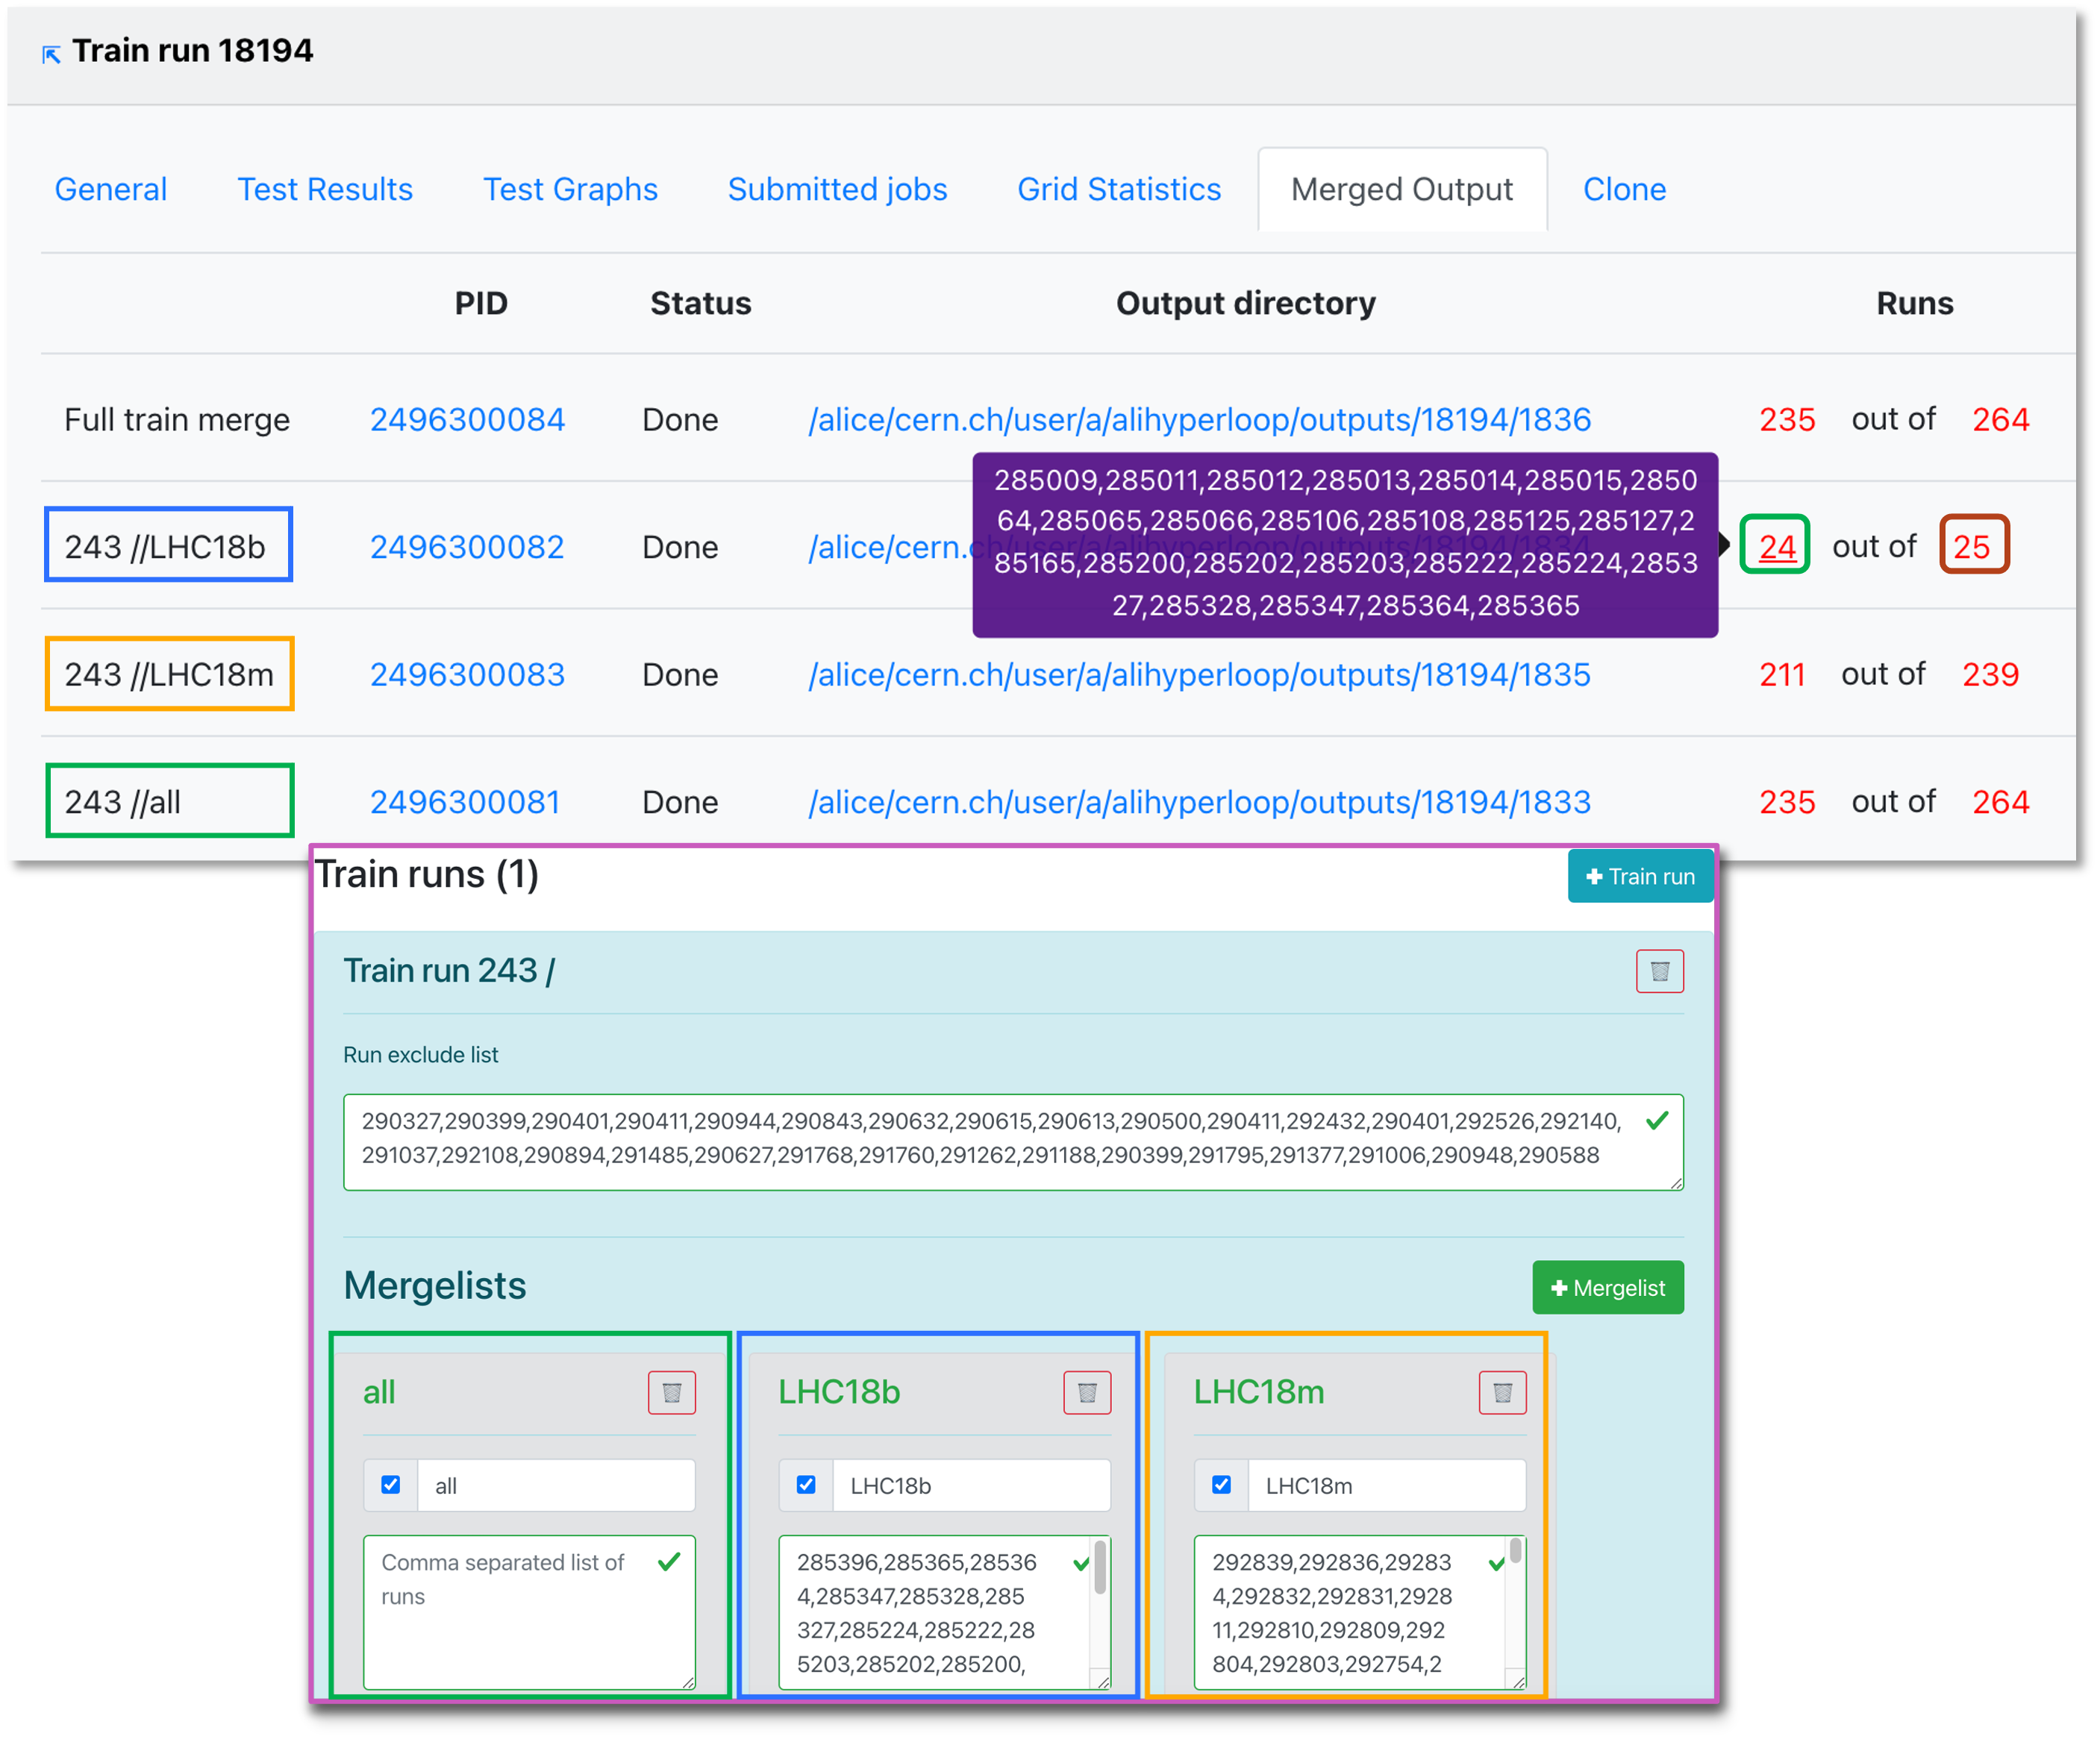
- When the final merge is started manually by the operator, some of the runs may not be merged. You can copy the list of merged runs or the total list of runs by clicking on the (red) number.
- Here you can also track the submission process, and debug issues that may have taken place.
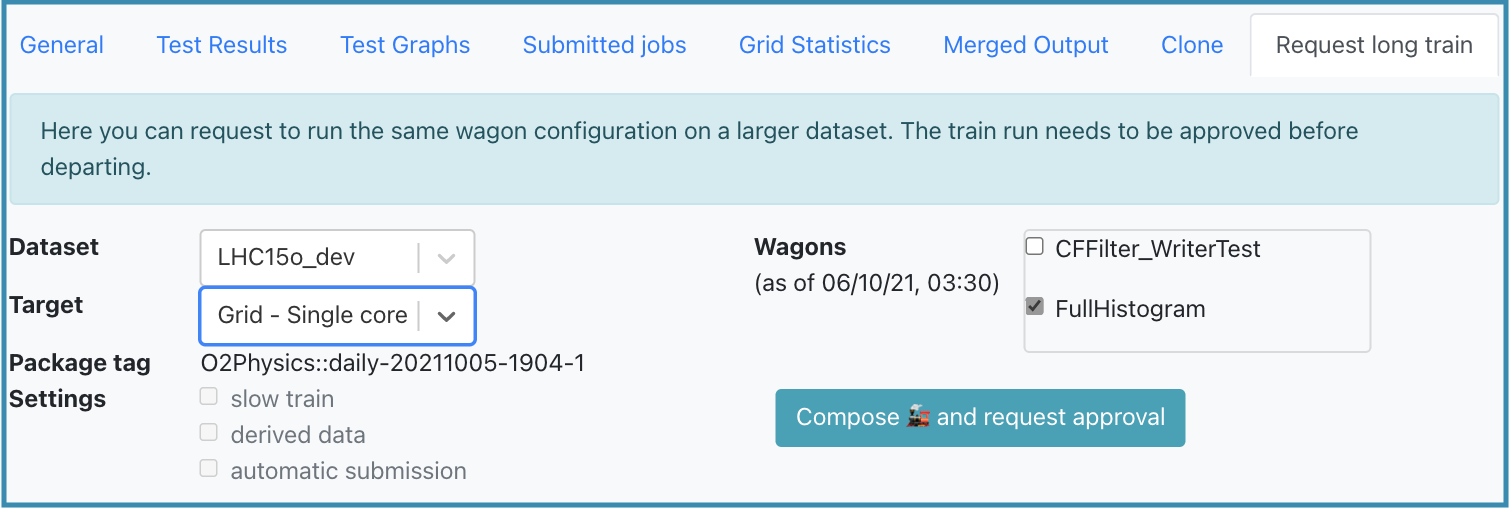
Request Long Train
- The Request long train tab allows users to request a long train after the train ran on a short dataset. Short datasets are subsets of a big dataset (set up in the Dataset settings). First, a train run needs to be Done on a smaller short dataset before being run on a bigger dataset.
- Any user who is part of the analysis can request a long train. Approval from the participating analyses PWGs conveners is required in order to submit a long train.
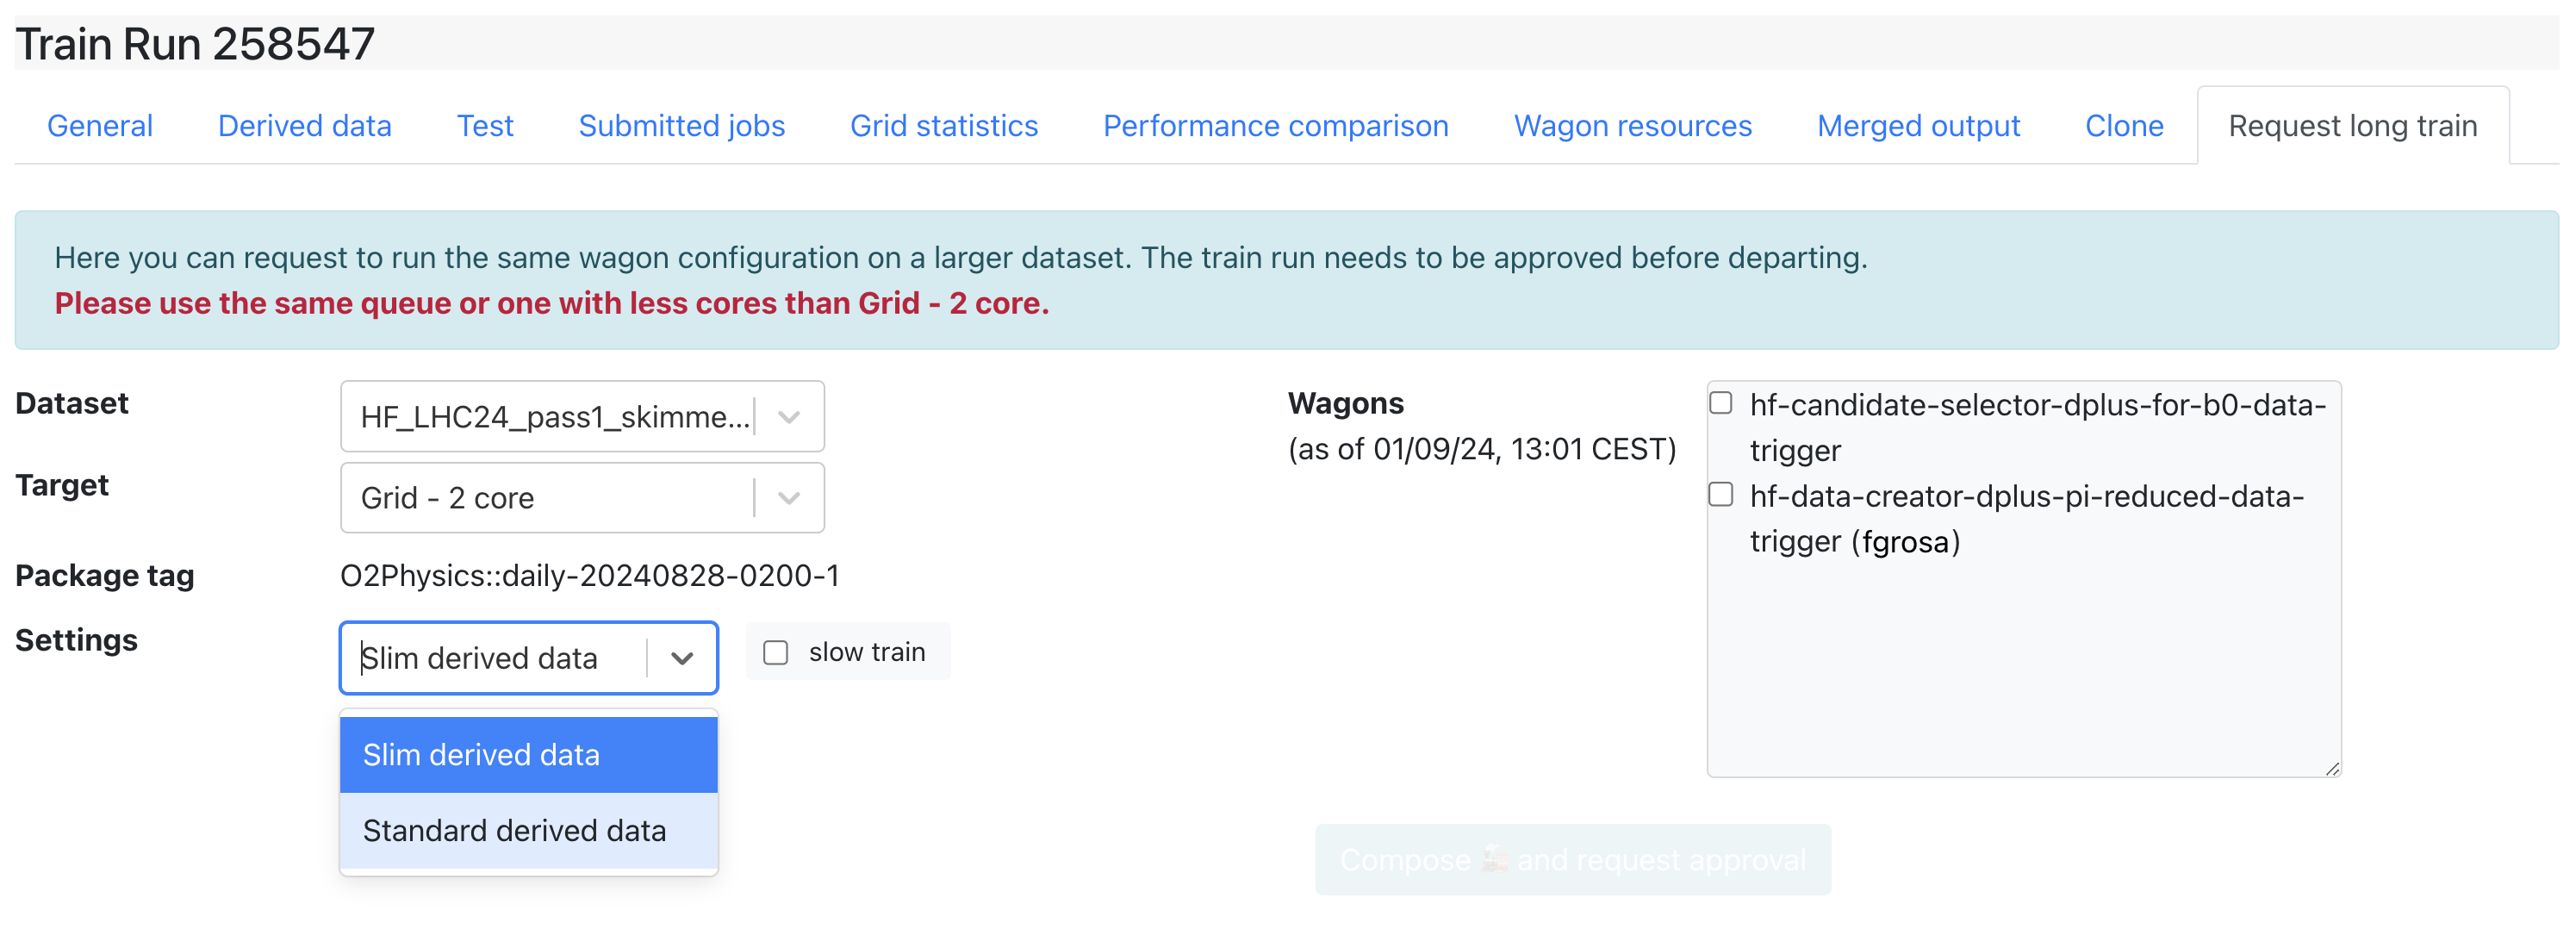
- When requesting a long train, it is possible to request standard derived data from a short train with slim derived data by changing the derived data setting as shown above.
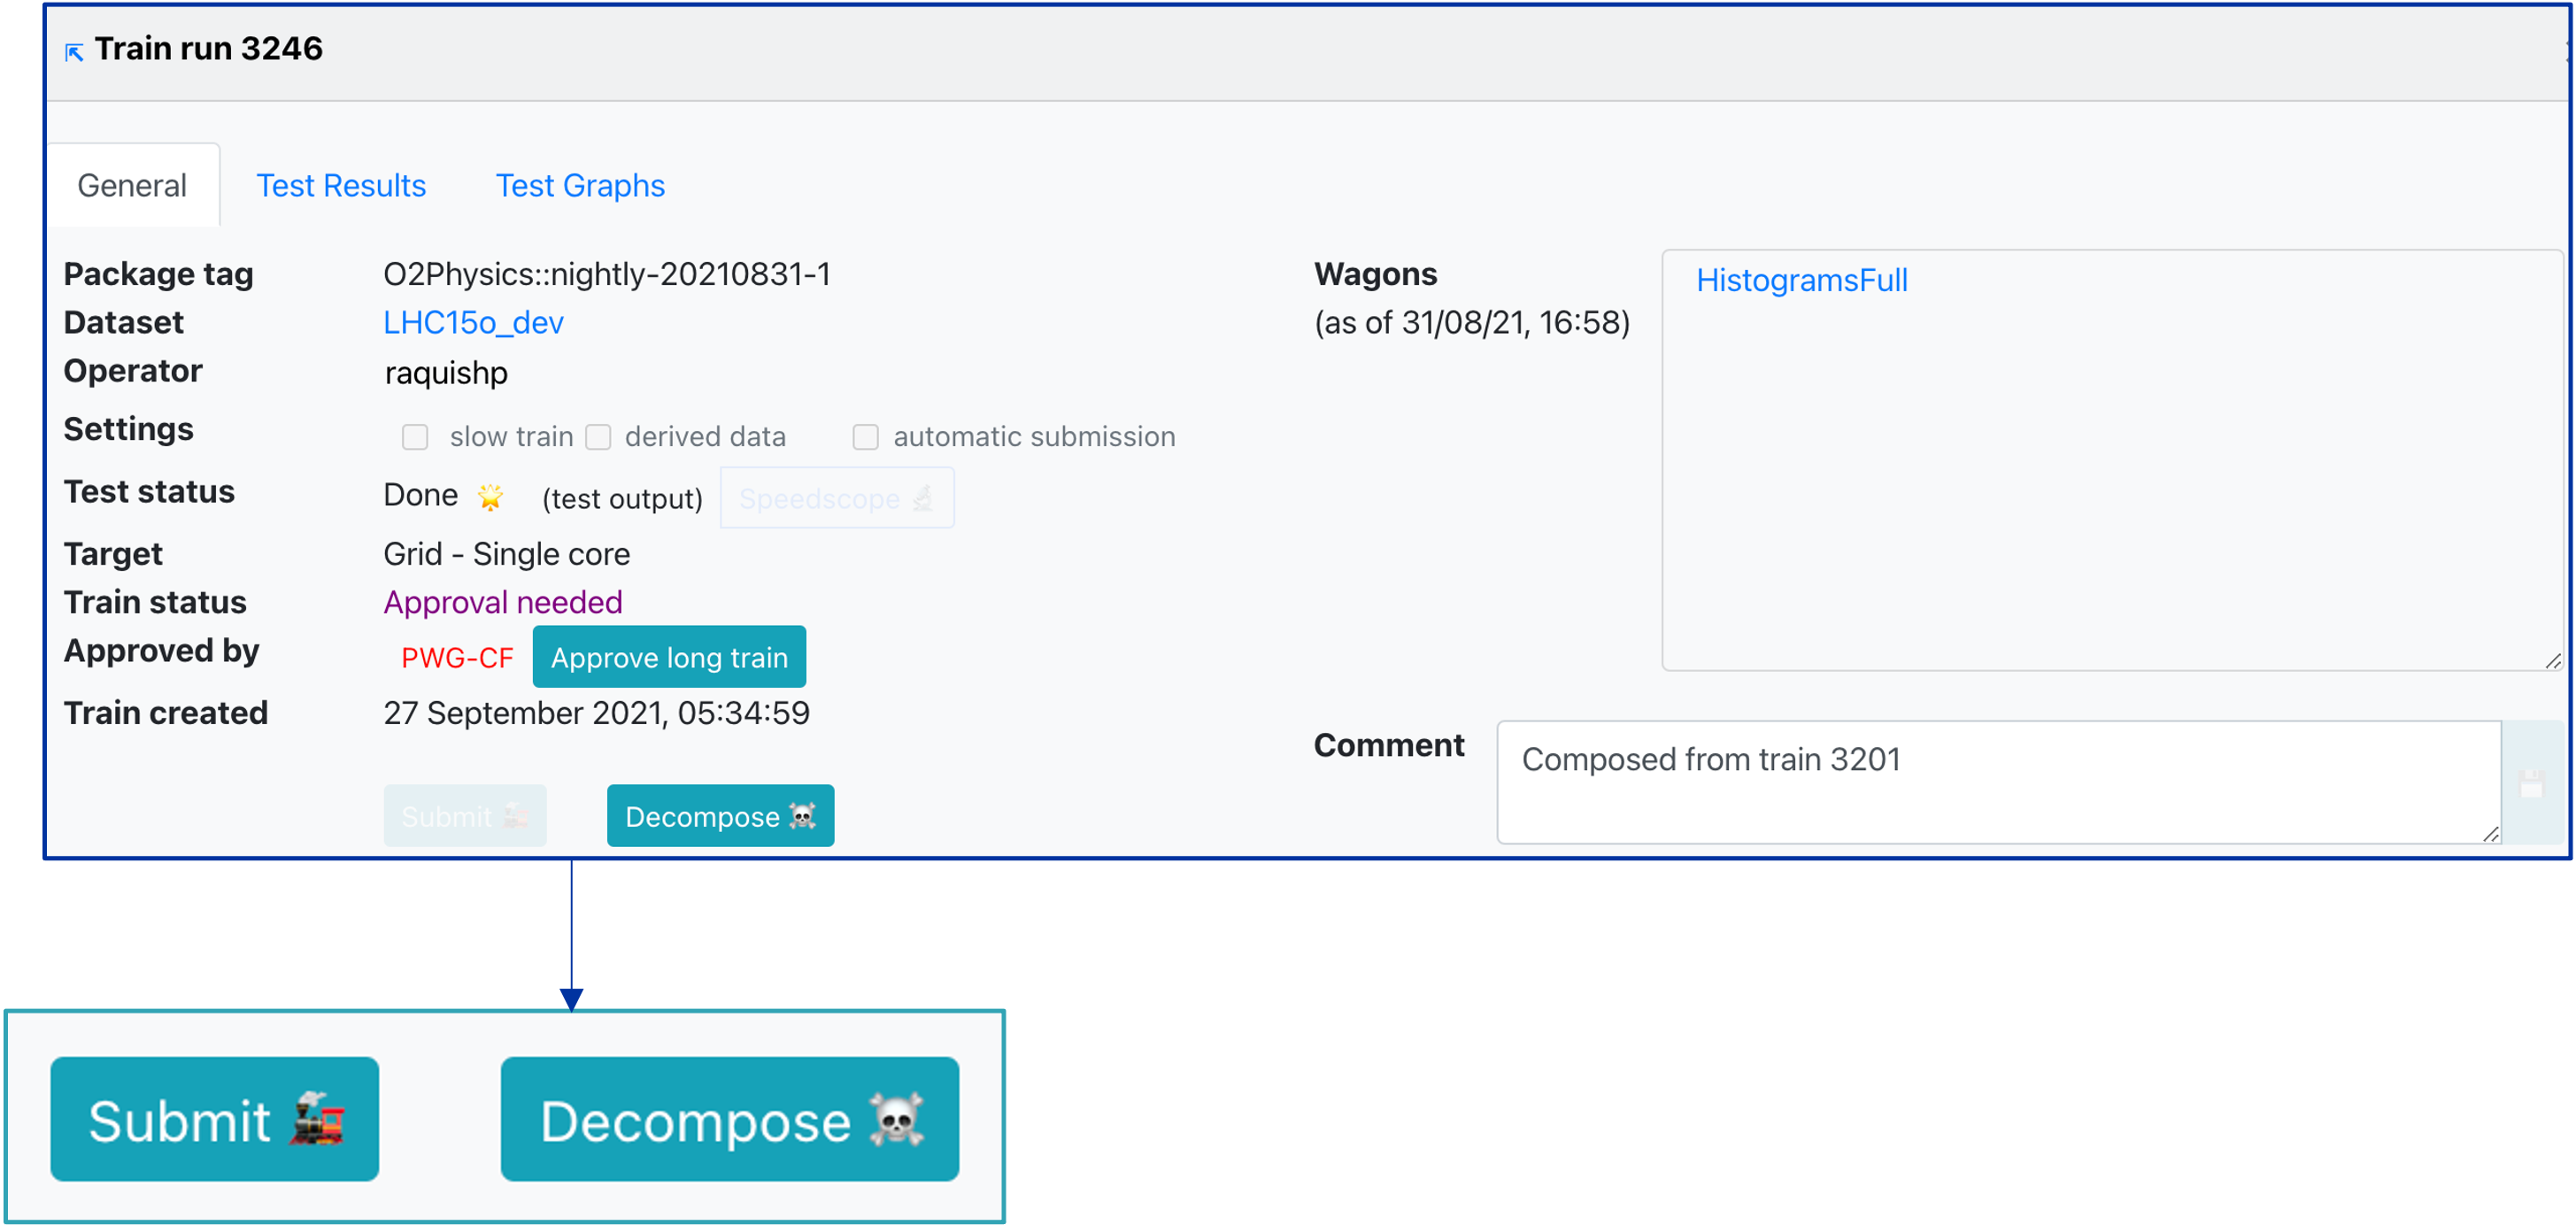
- Once the long train is approved:
- If Automatic Submission is enabled and the train test finished without memory warning and within the CPU time limit, the train is submitted
- Otherwise the Submit button is enabled and the operator can submit the train
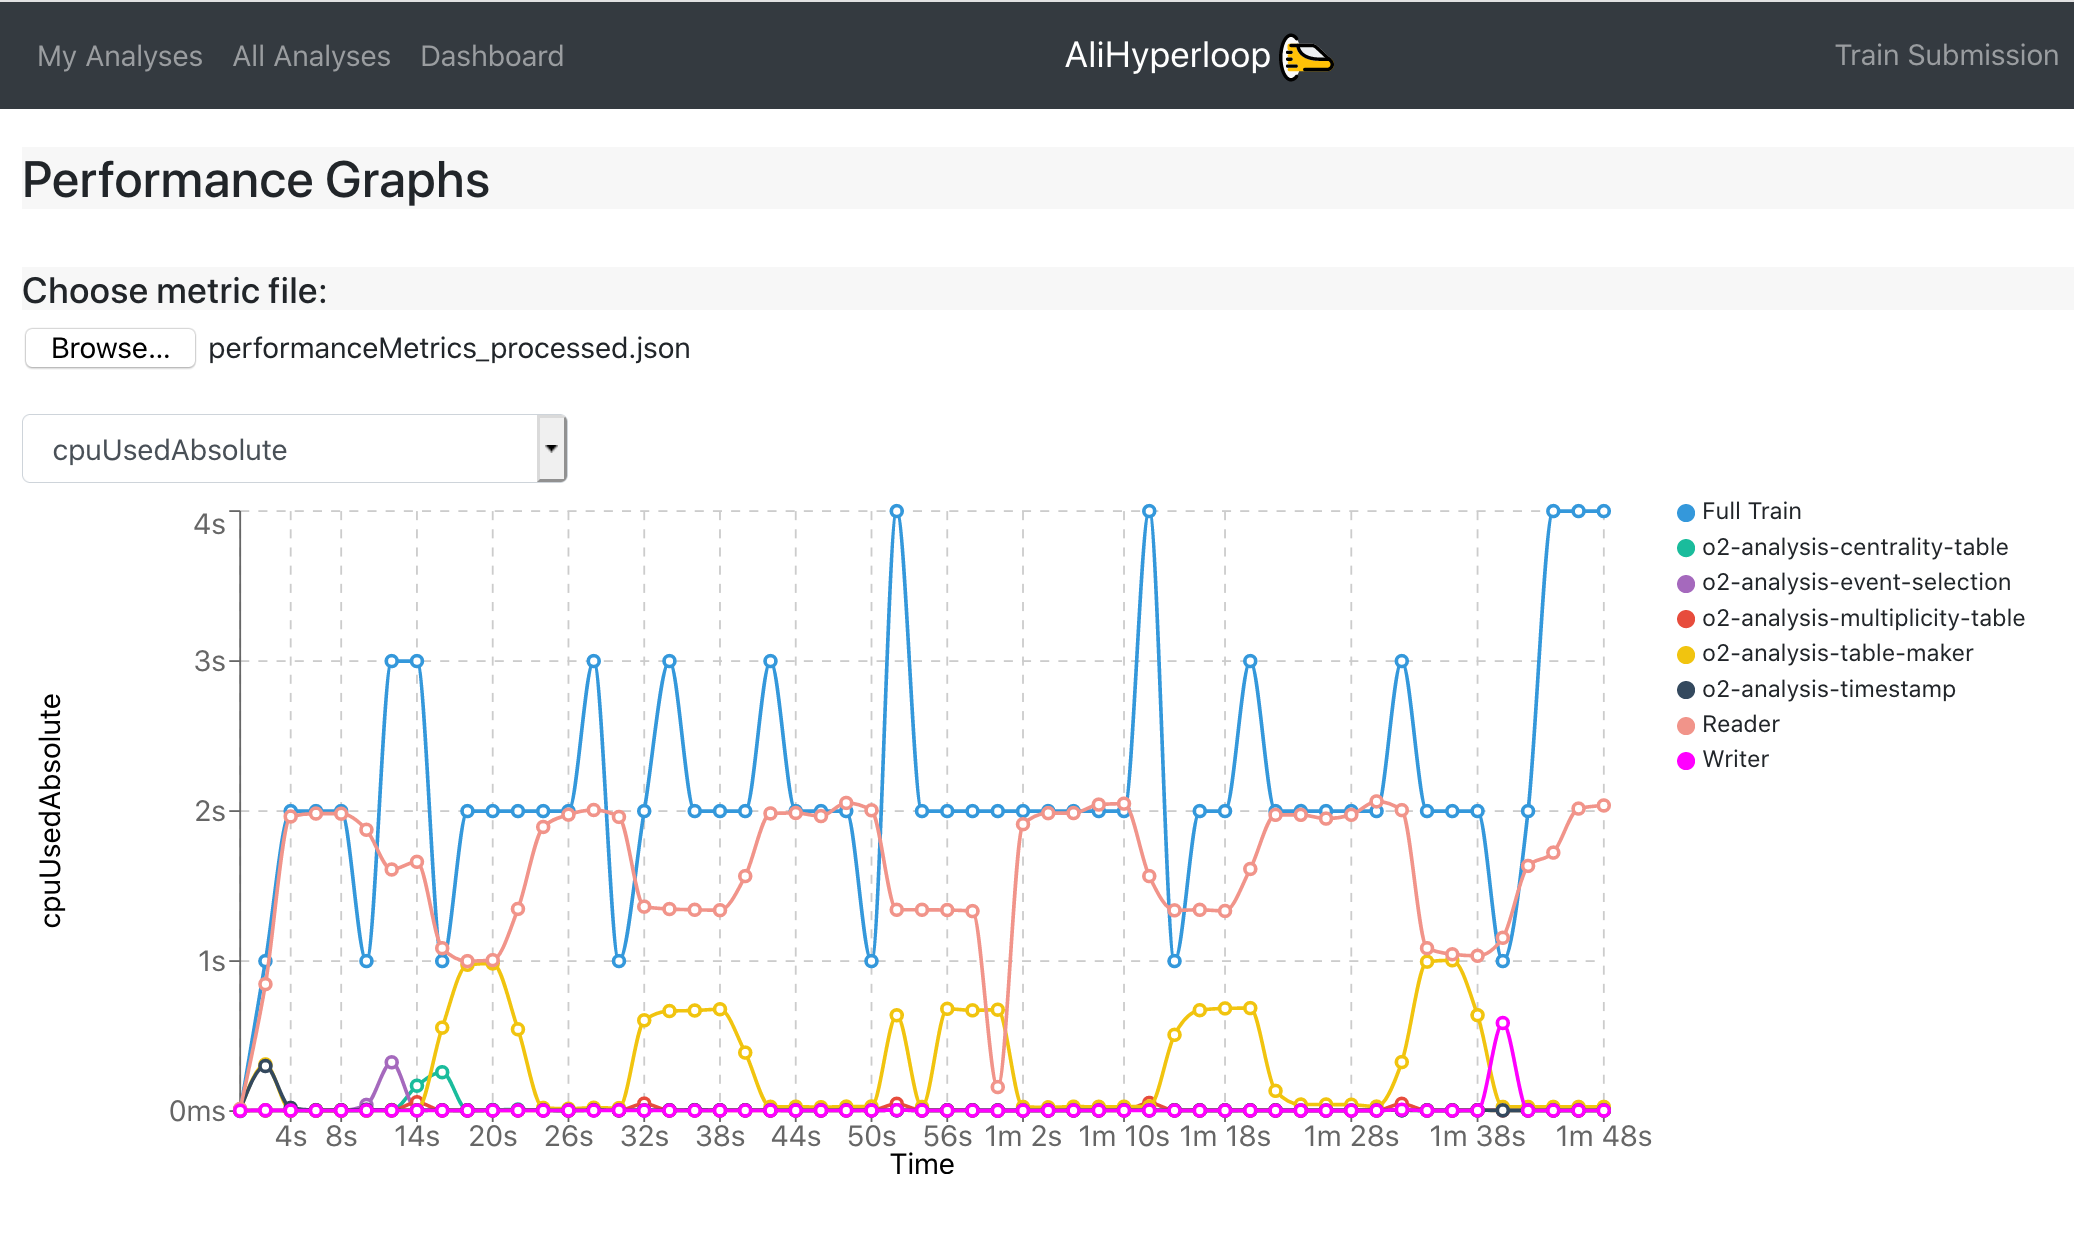
Producing performance graphs for a local O2 execution
Performance Graphs page allows the user to upload his own local metrics file, and then generate the test graphs specific to that file. You produce a local performanceMetrics.json by running the o2 workflow with the argument –resources-monitoring 2 which, in this example, produces monitoring information every 2 seconds. These are the same type of graphs produced in the Test Graphs tab of the train run. This page can be accessed at: https://alimonitor.cern.ch/hyperloop/performance-graphs.
Reproducing a train run on a local machine
A train test or a Grid train run can be redone on a local machine. This is useful to understand a problem better or to just reproduce some settings of a previous train. In order to do so, you need two general prerequisites:
- Download the
run_train.shscript from here. Say this is placed in a folder/my/path/. - Make sure
jqis installed on your system. Typejqon the command prompt. If you get an error that the command was not found, you have to install it. This package is a system package on most systems (it has nothing to do with ALICE). Use Google if you need instructions for your specific operation system. - Now the following command should work and give reasonable output:
/my/path/run_train.sh --help
To now run a specific train test or Grid run, you need to create a folder and put there two files:
- Download the
full_config.jsonfrom the train test or Grid run - Create a file
input_data.txtin which you put the file paths of the data you want to process. You can either put the paths to files on AliEn or download the data locally and point to the local paths. Each line should contain one file. In order to take the same data as from a train test, you can check at the top of thestdout.logof a train test where you have the AliEn paths and also paths to download the files to your local machine. You then run:
/my/path/run_train.sh --skip-perf
Train slots per week
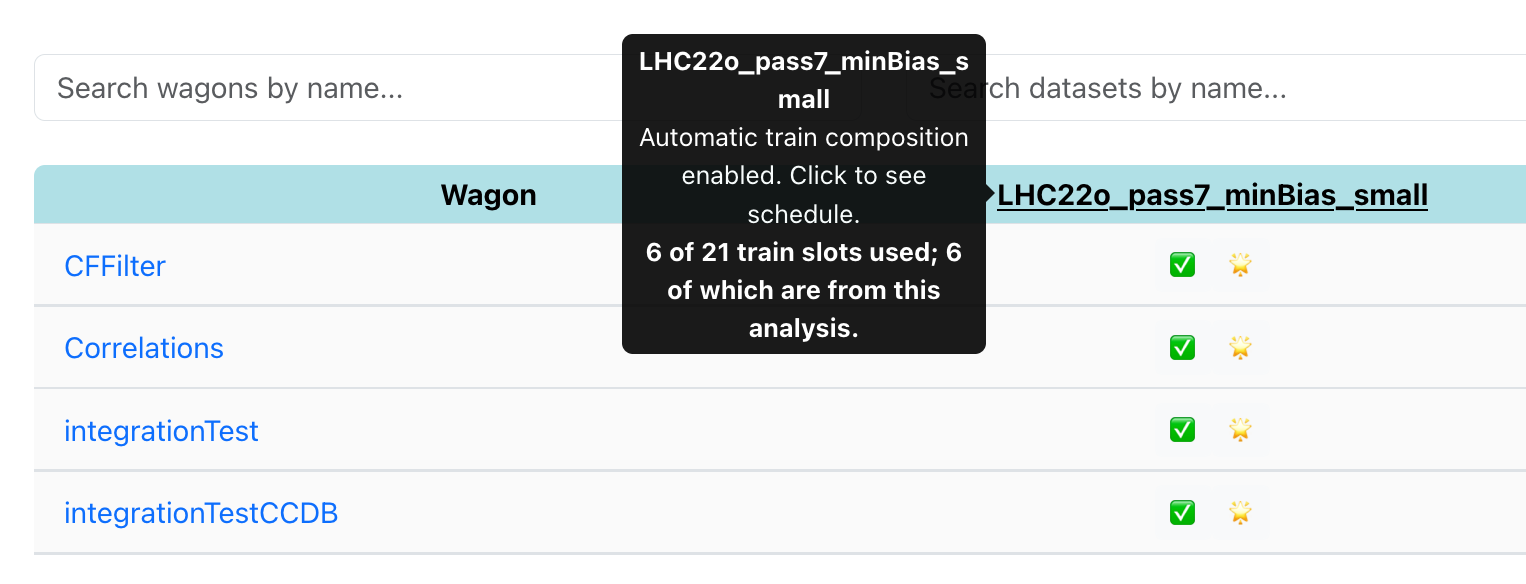
For a given analysis, every dataset has a train slots per week limit. This limit is shown in the dataset under ‘Maximal train slots per analysis per week'. If an analyzer uses the same dataset across multiple analyses, the calculation (for the analyzer only) is the summed slots across analyses.
These limits ensure fair usage of resources, and are calculated on a rolling basis. You may view how many slots have been used for a dataset from the wagon table in My Analyses:
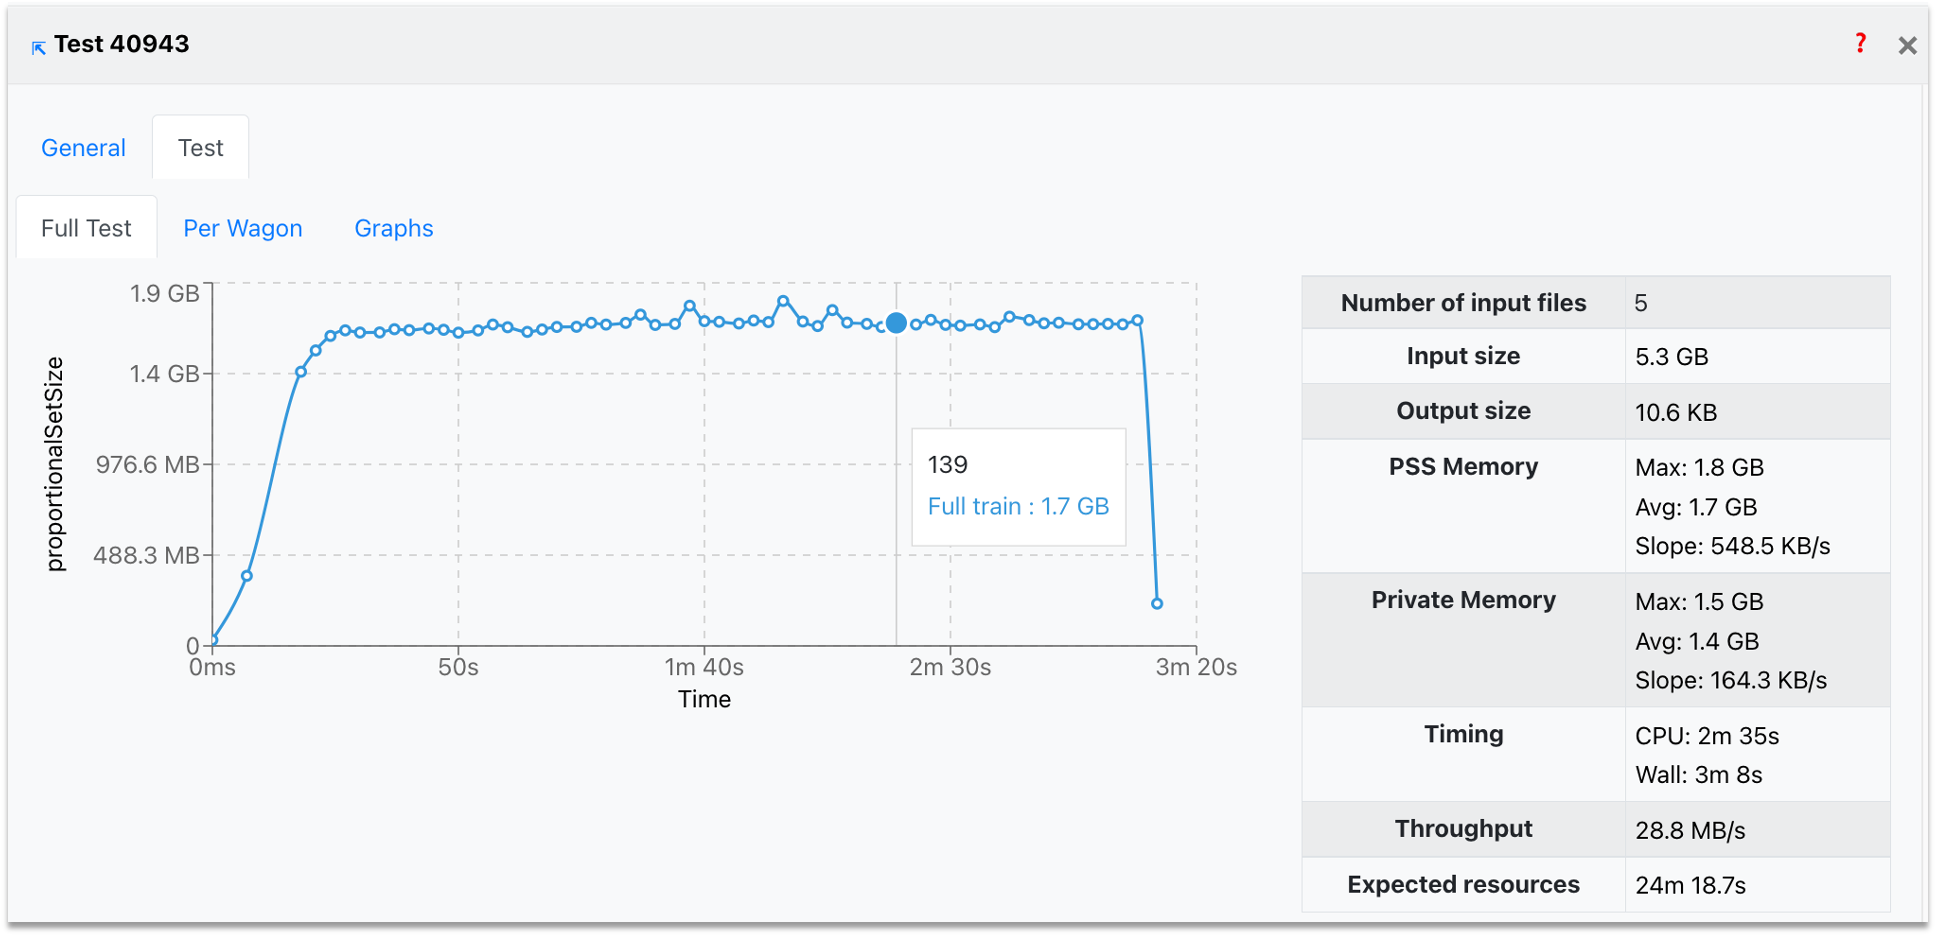
Trains may use more than one slot. The number of slots is calculated as the number of wagons from the analysis in the train, capped by the number of cores that the train runs with. The slots used per analysis may be viewed in the train ‘Test - Full Test' tab, where also the time when the train will stop counting towards the quota is shown:
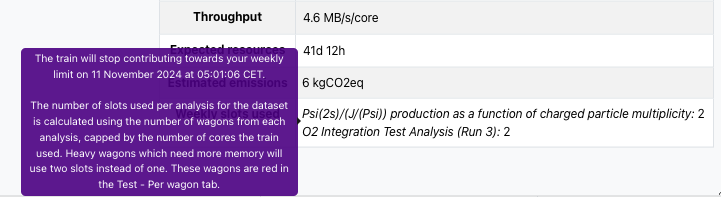
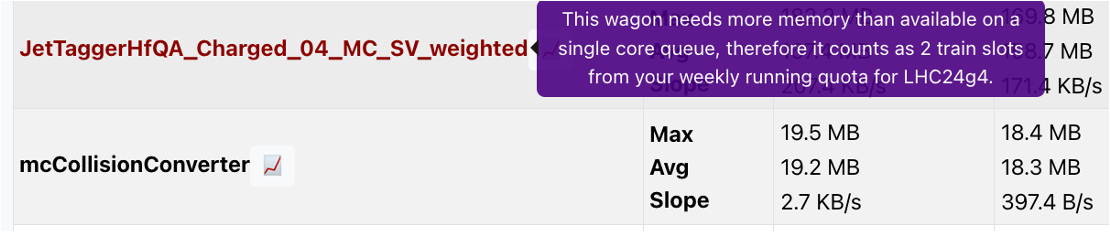
If a single user wagon needs more memory than available in a single core queue, it can still be composed by hyperloop to the two core queue but it will count as a heavy wagon. Heavy wagons count as two slots. These wagons are listed in red in the train ‘Test - Per Wagon' tab:
Local merging scripts
Here is a repository containing scripts to download all output files from a Hyperloop train run by run, and to merge locally only the files associated to a given run list.